Scalar UI
Marketing UIApp UIAIChartsBackgrounds
Sign inGet started
Scalar UI
Scalar UI© 2026 Scalar Limited

React · Tailwind CSS · Motion

Browse

HomeAll components 213

Collections

Marketing UI 107App UI 94AI 16Charts 45Backgrounds 2Text 43

More

Text 43

Charts

All Charts 45
Bar chart 2
Stacked bar 2
Horizontal bar 2
Line chart 3
Area chart 3
Spark chart 1
Pie chart 2
Donut & semi-donut 2
Radial chart 1
Hexagon chart 3
Heatmap 2
Funnel chart 3
Category bar 2
Segmented progress 1
Scatter & bubble 2
Combo chart 2
Waterfall 2
Diverging bar 2
Candlestick 2
Treemap 2
Waffle chart 2
Sankey 2

Resources

Docs & installScalar Design

Charts

Waterfall

How a total becomes another, step by step.

2 results

2 results
Gradient Waterfall Chart preview

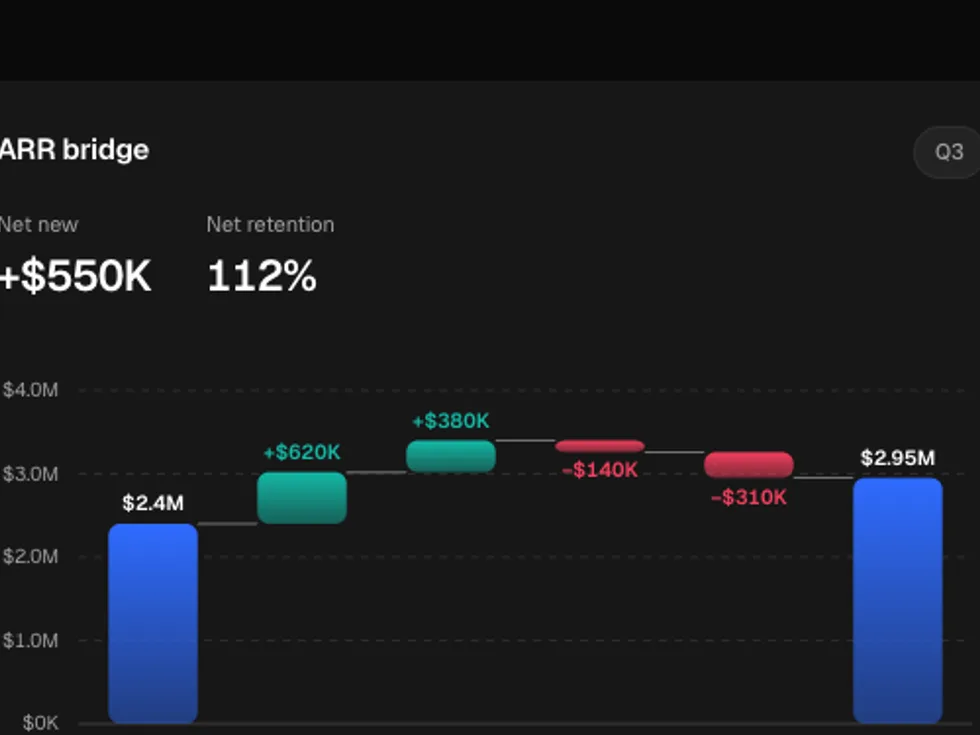
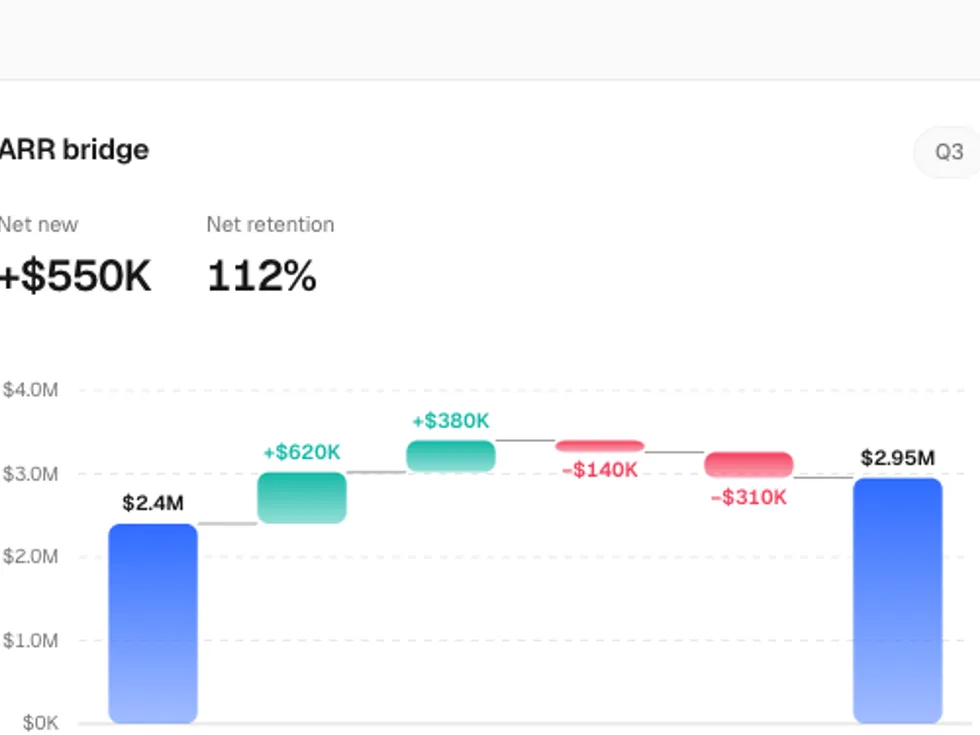
Gradient Waterfall Chart

Chart

Changes that float from the running total, joined by dashed connectors, with totals on the floor; columns grow in one after another — soft gradient fills that fade into the floor.
Outlined Waterfall Chart preview

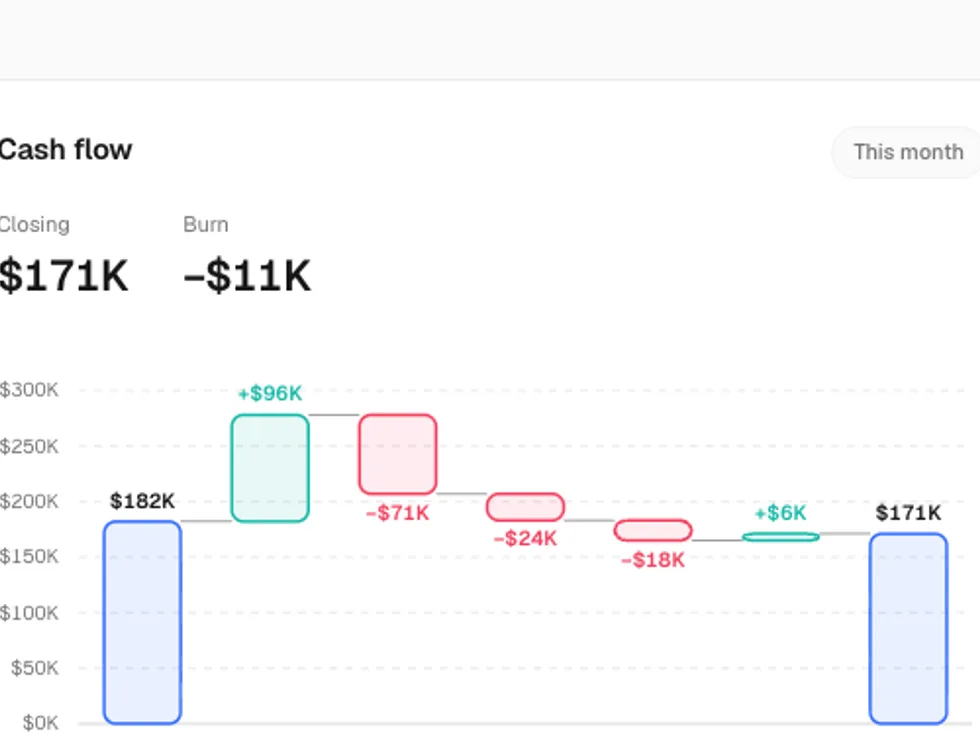
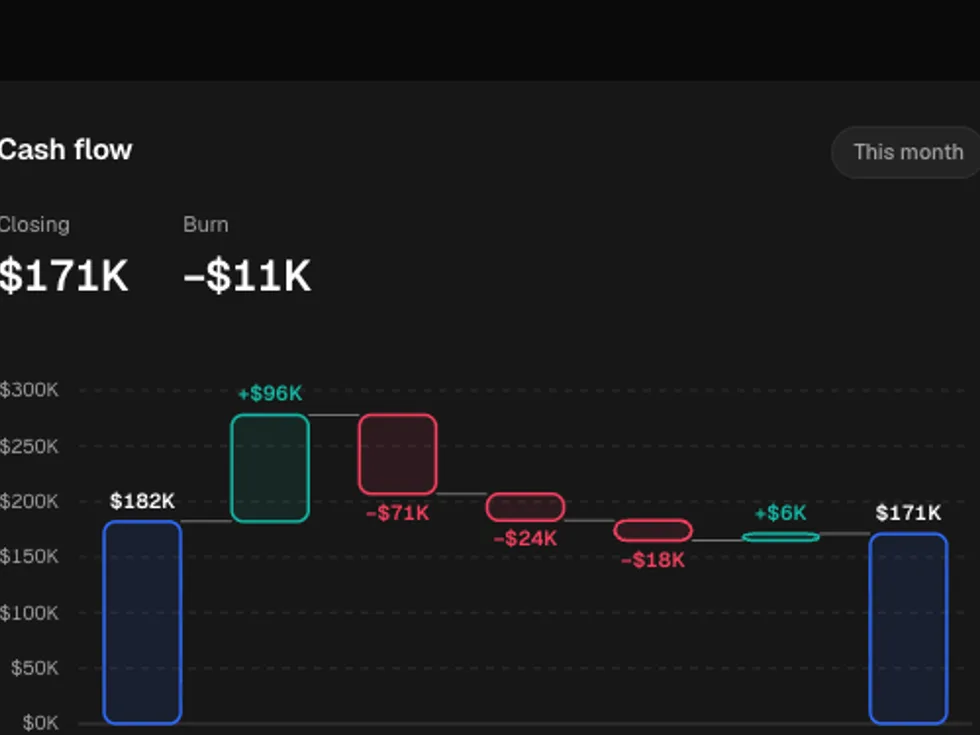
Outlined Waterfall Chart

Chart

Changes that float from the running total, joined by dashed connectors, with totals on the floor; columns grow in one after another — hairline outlines over a faint tint.

AllMarketing UIApp UIAIChartsBackgroundsText
Bar chartStacked barHorizontal barLine chartArea chartSpark chartPie chartDonut & semi-donutRadial chartHexagon chartHeatmapFunnel chartCategory barSegmented progressScatter & bubbleCombo chartWaterfallDiverging barCandlestickTreemapWaffle chartSankey