Charts
Data visualisation in gradient and outlined finishes, with sparkle where it suits — tooltips and entrance motion throughout.
45 results
45 results
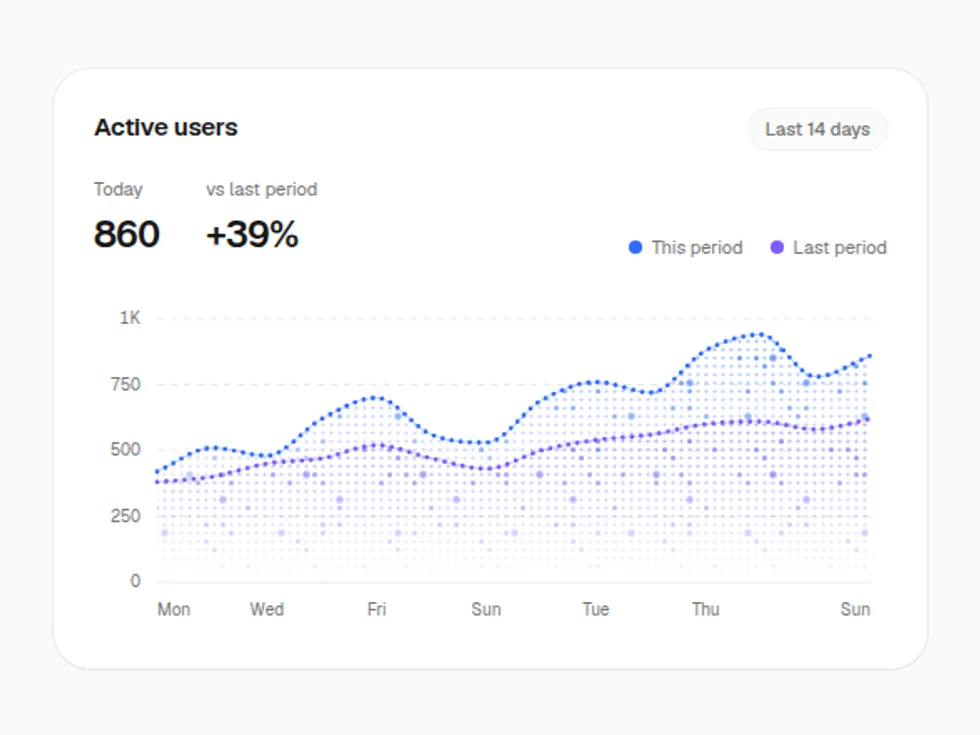
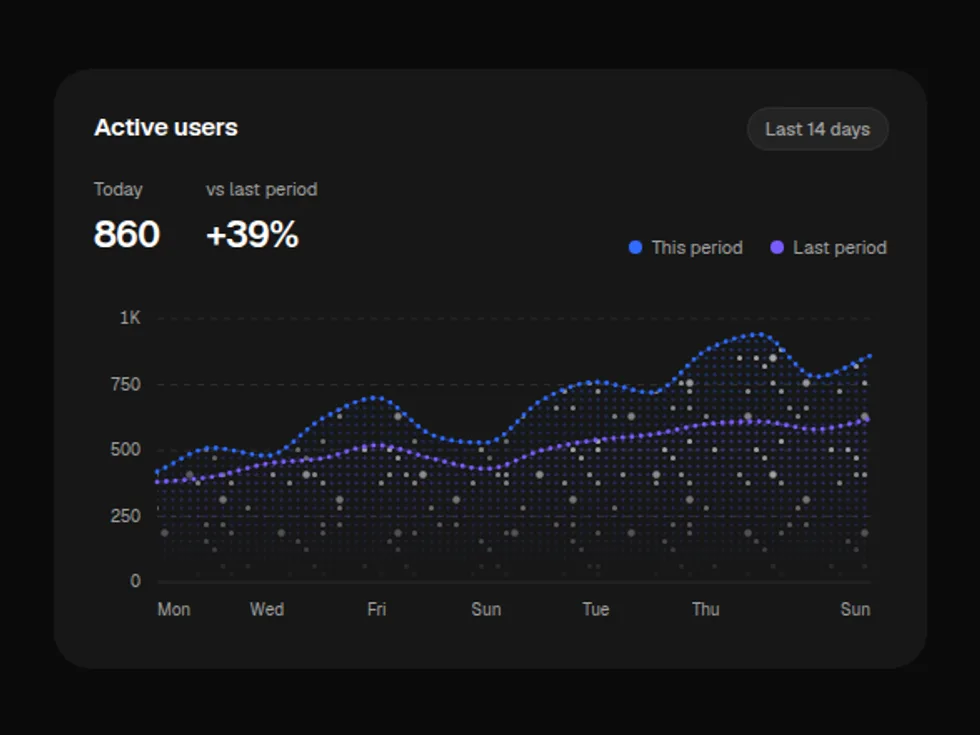
Sparkle Line Chart
ChartSmooth lines that draw in from the left, with a crosshair tooltip across every series — an electrified dot grid with twinkling four-point sparks.
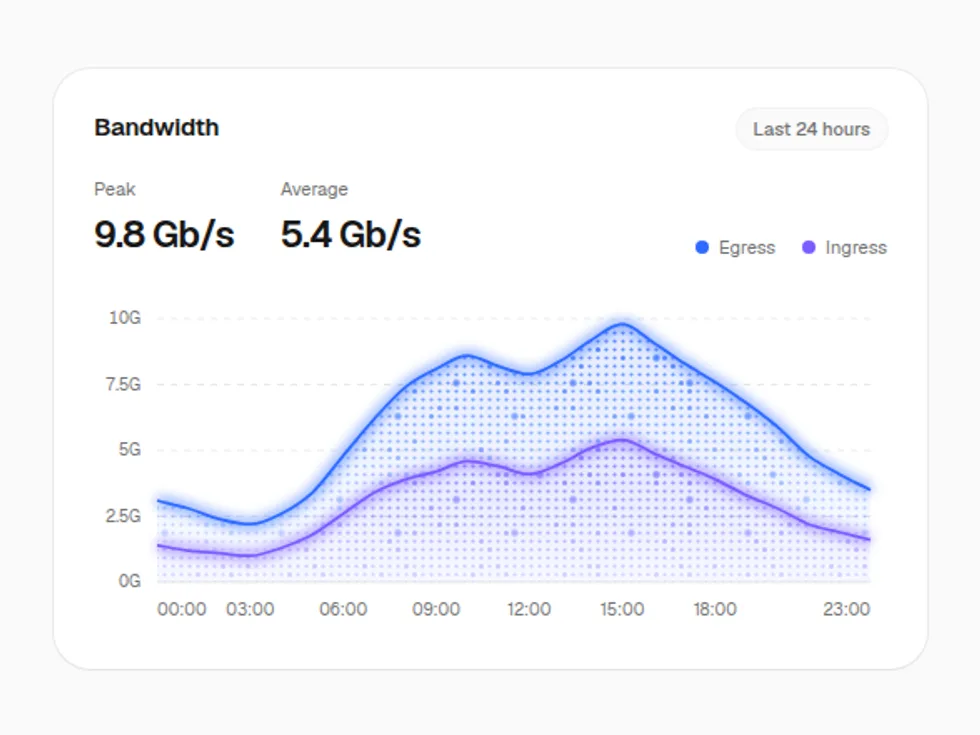
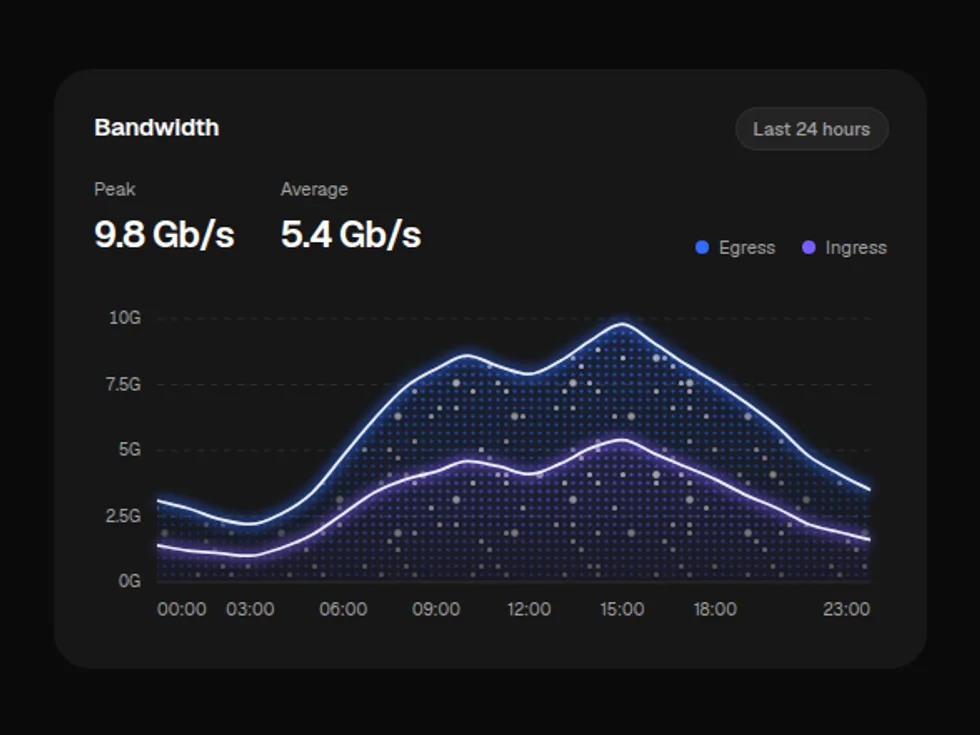
Sparkle Area Chart
ChartFilled trends that sweep in from the left, overlapping or stacked, with a crosshair tooltip — an electrified dot grid with twinkling four-point sparks.
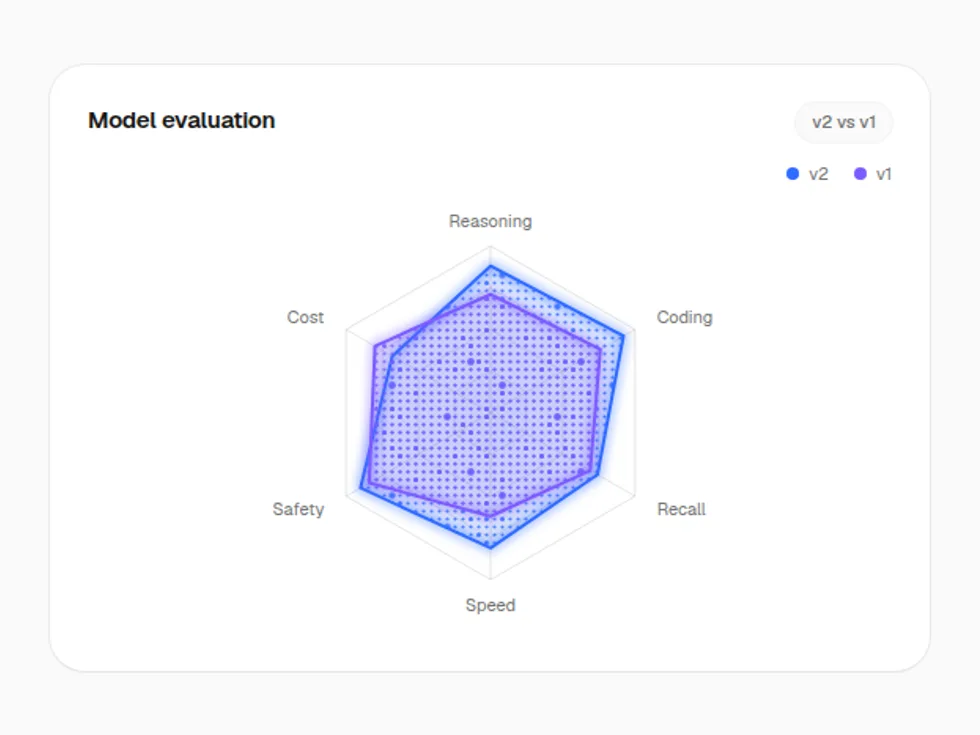
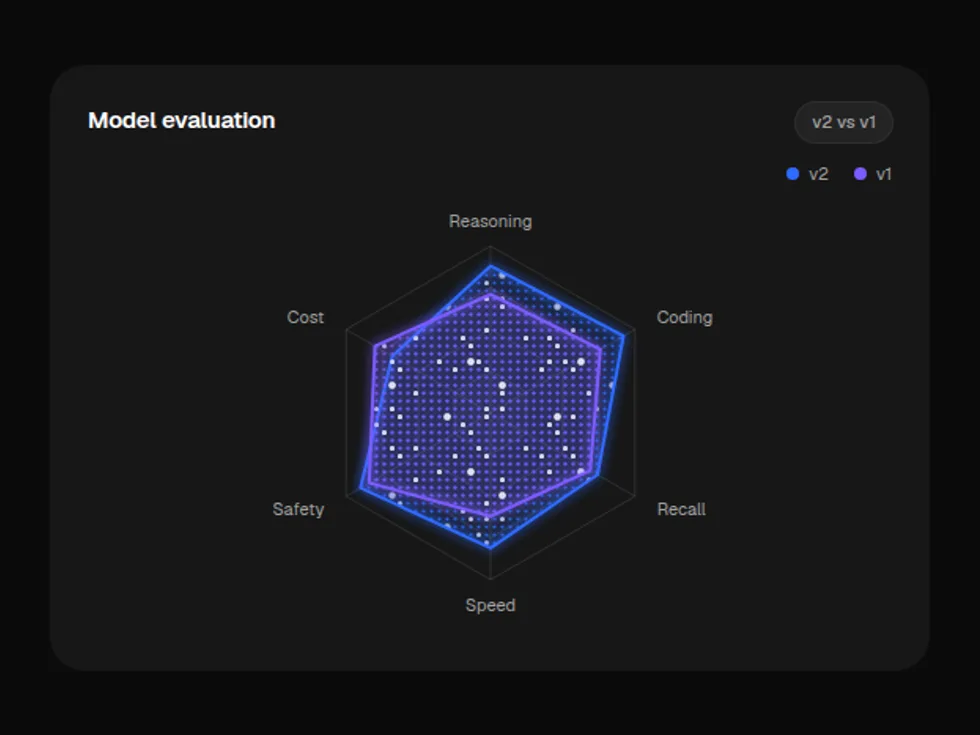
Sparkle Hexagon Chart
ChartA radar chart on a hexagonal grid; each series grows out of the centre — an electrified dot grid with twinkling four-point sparks.
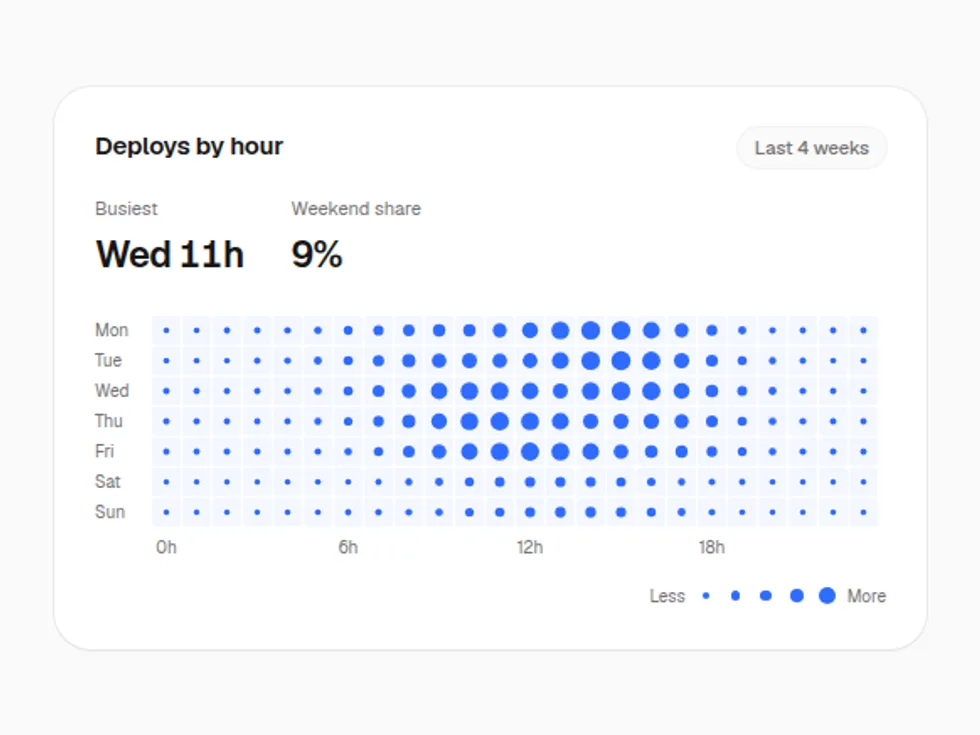
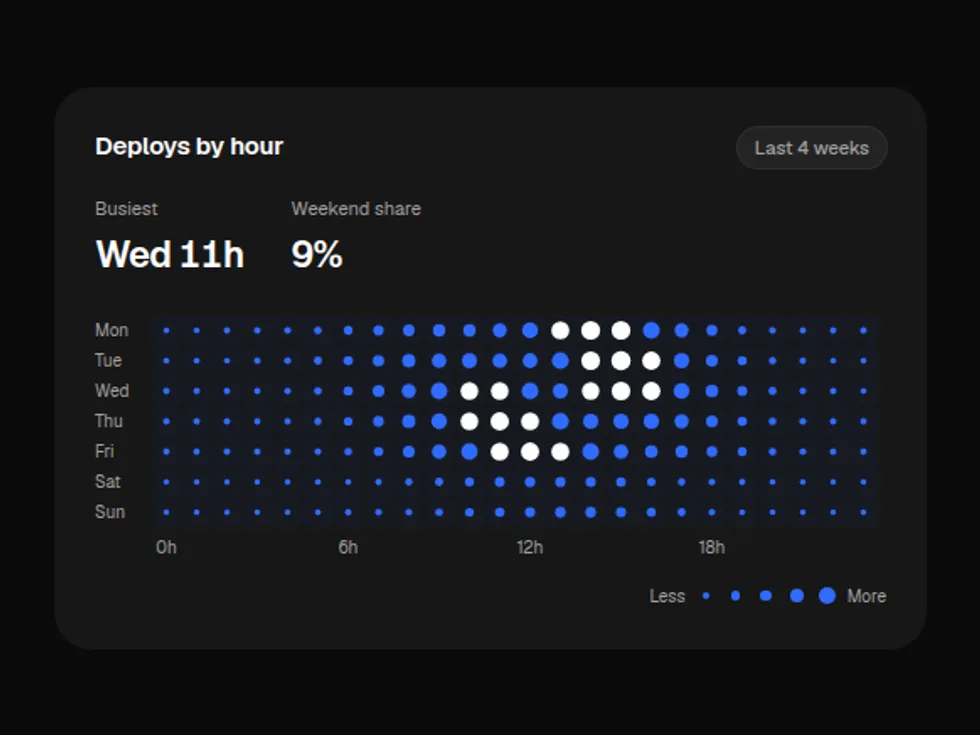
Sparkle Heatmap
ChartA grid shaded by value that cascades in diagonally, with a row-and-column crosshair on hover — an electrified dot grid with twinkling four-point sparks.
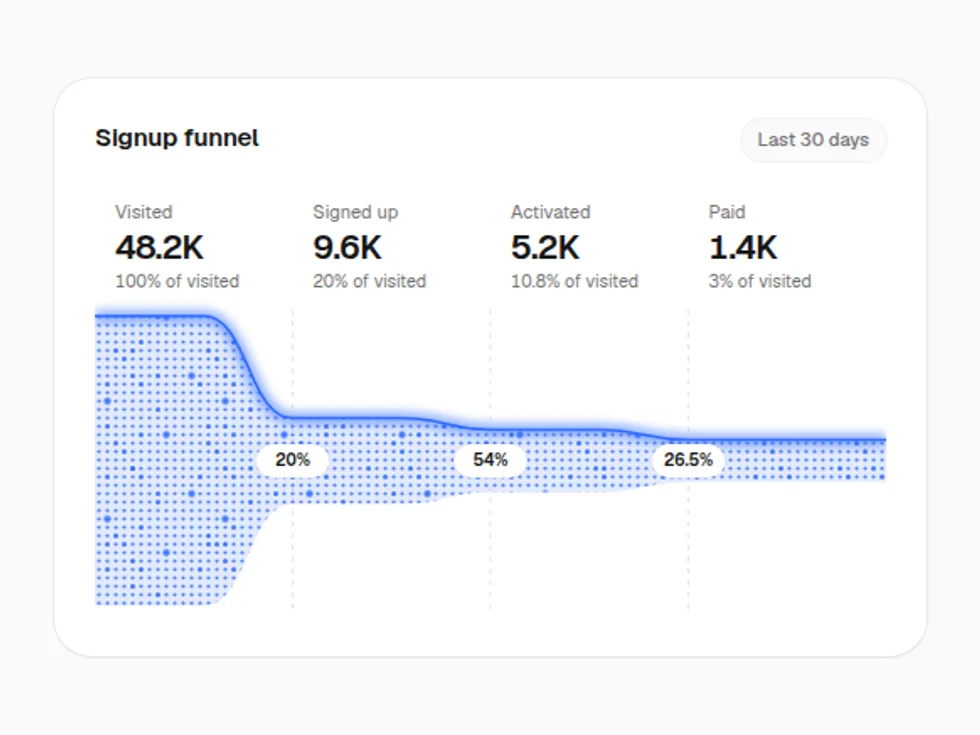
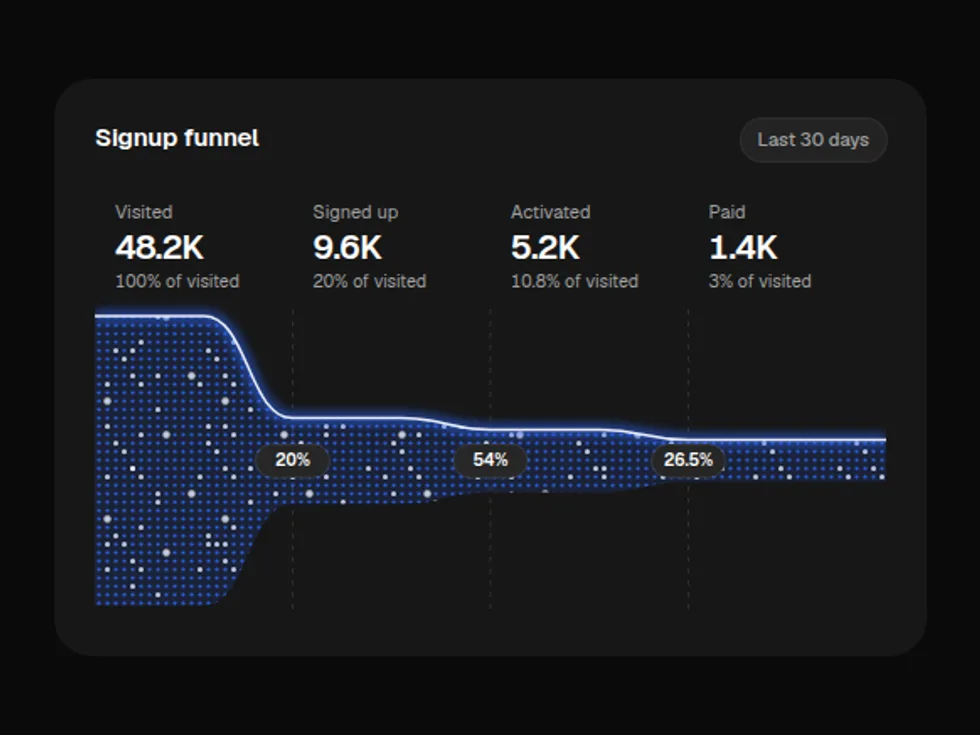
Sparkle Funnel Chart
ChartOne band that narrows stage by stage, with counts, shares and step-conversion pills — an electrified dot grid with twinkling four-point sparks.
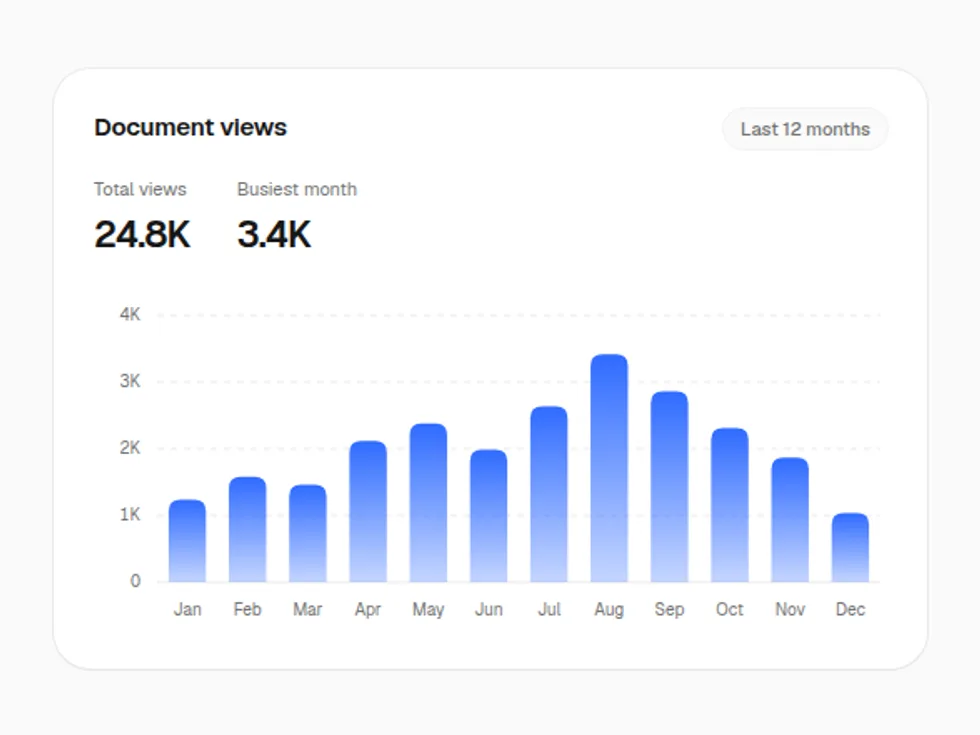
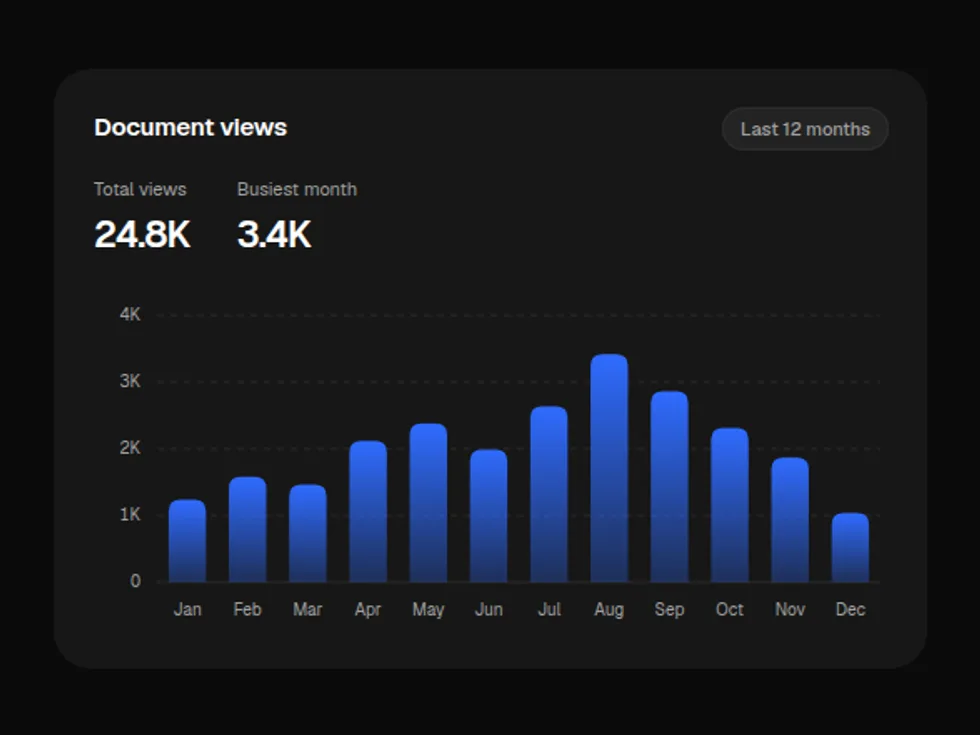
Gradient Bar Chart
ChartColumns that spring up on a dashed grid, with a pointer-following tooltip — soft gradient fills that fade into the floor.
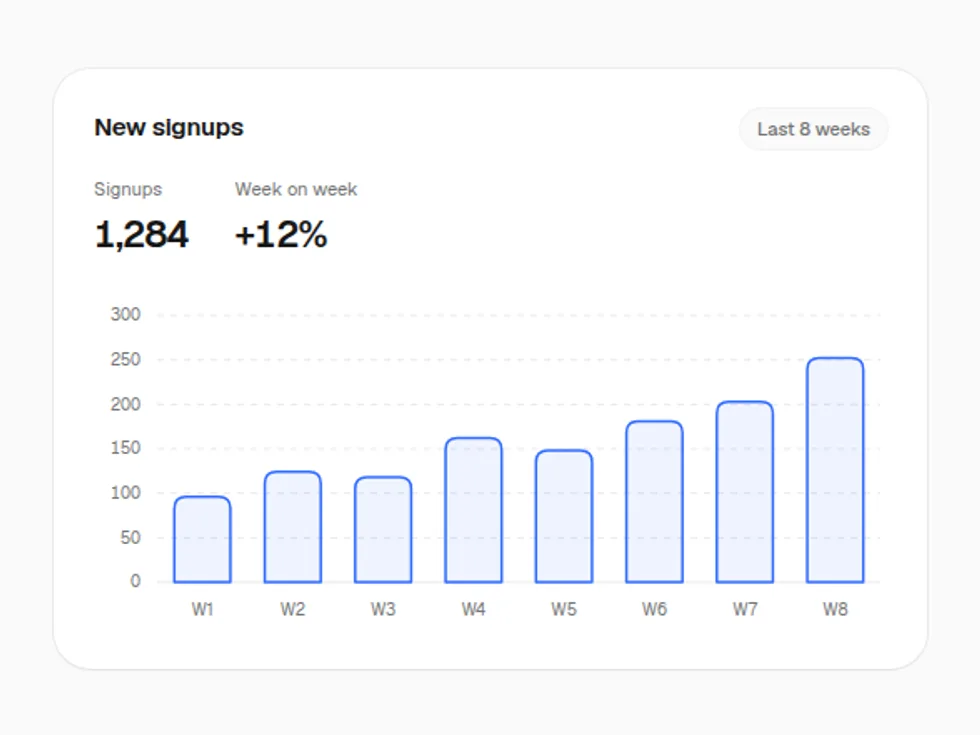
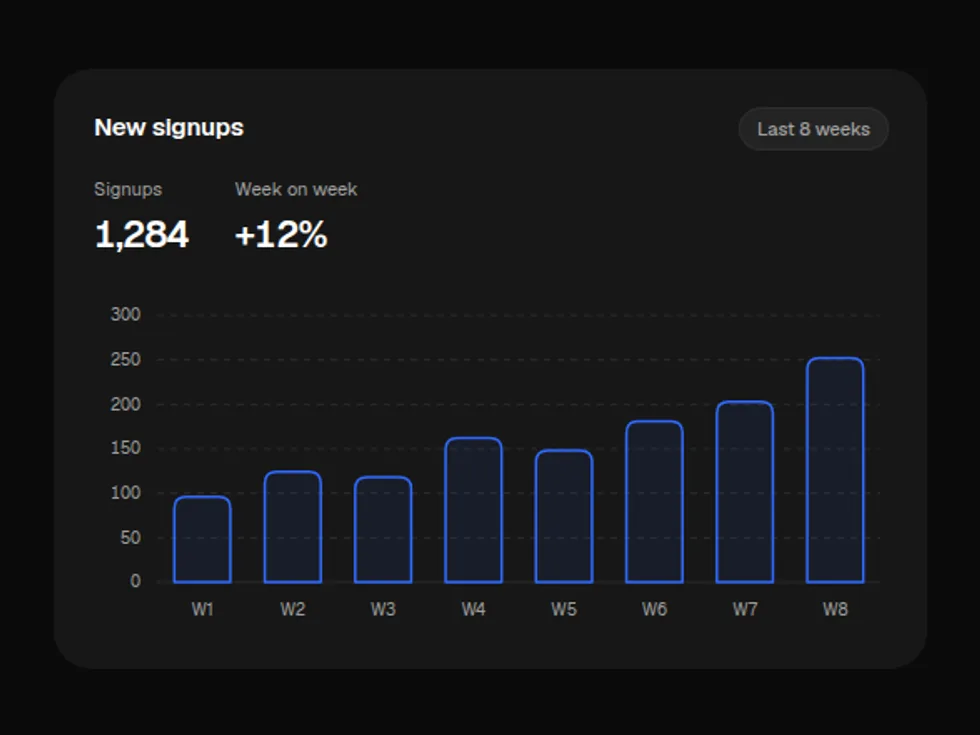
Outlined Bar Chart
ChartColumns that spring up on a dashed grid, with a pointer-following tooltip — hairline outlines over a faint tint.
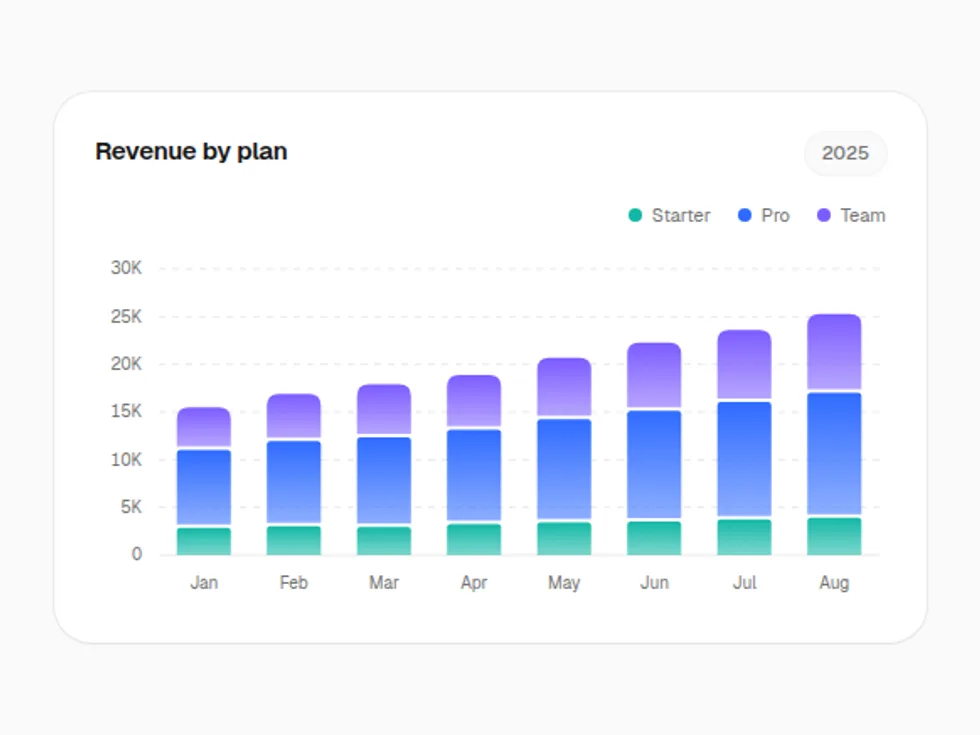
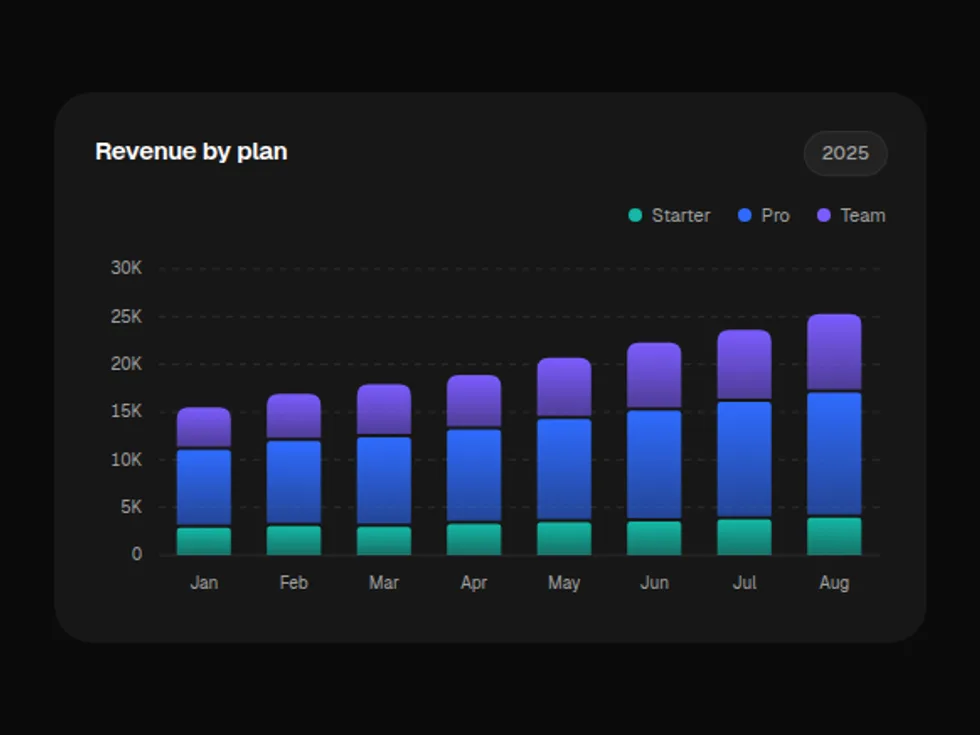
Gradient Stacked Bar Chart
ChartColumns of stacked segments that rise together, with every series and the total in the tooltip — soft gradient fills that fade into the floor.
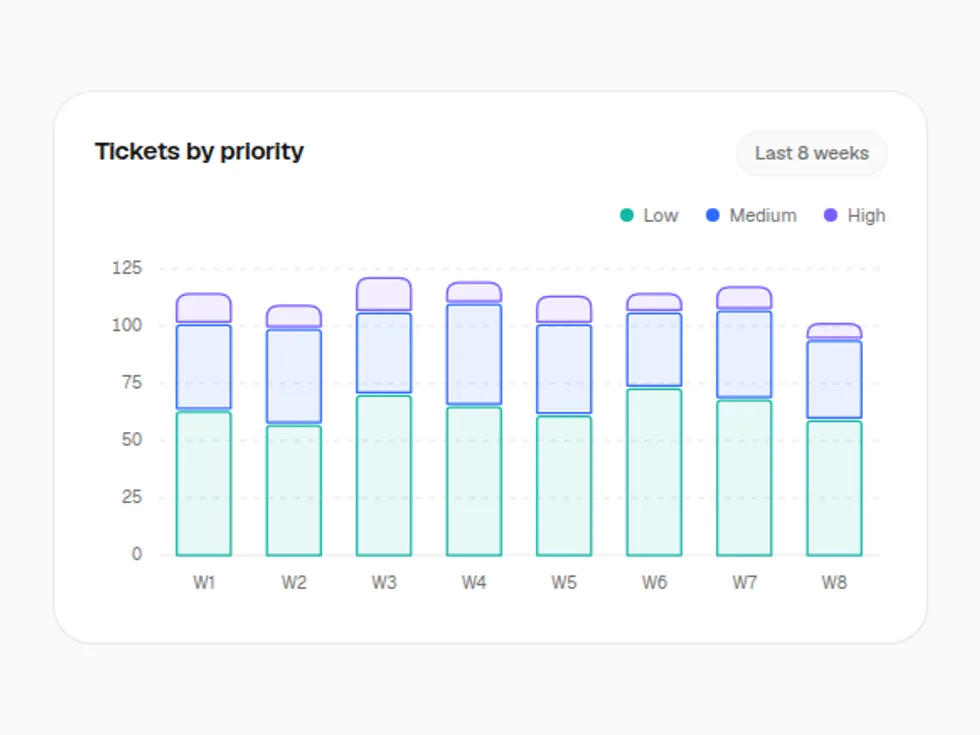
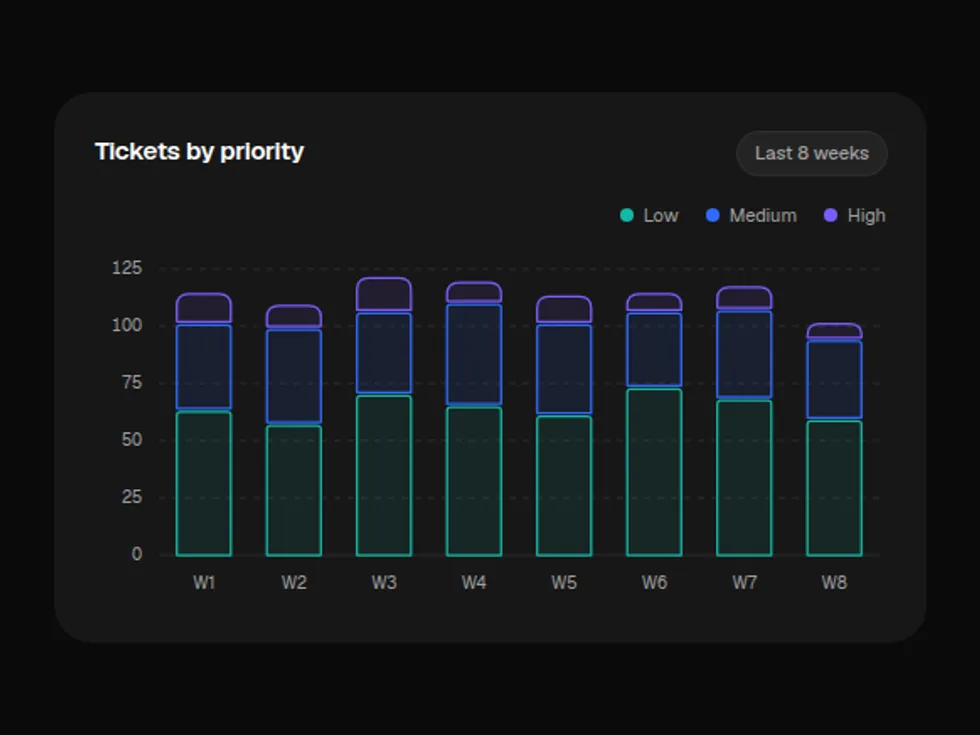
Outlined Stacked Bar Chart
ChartColumns of stacked segments that rise together, with every series and the total in the tooltip — hairline outlines over a faint tint.


Gradient Horizontal Bar Chart
ChartA ranked list of bars that slide out one after another, label inside and value at the end — soft gradient fills that fade into the floor.
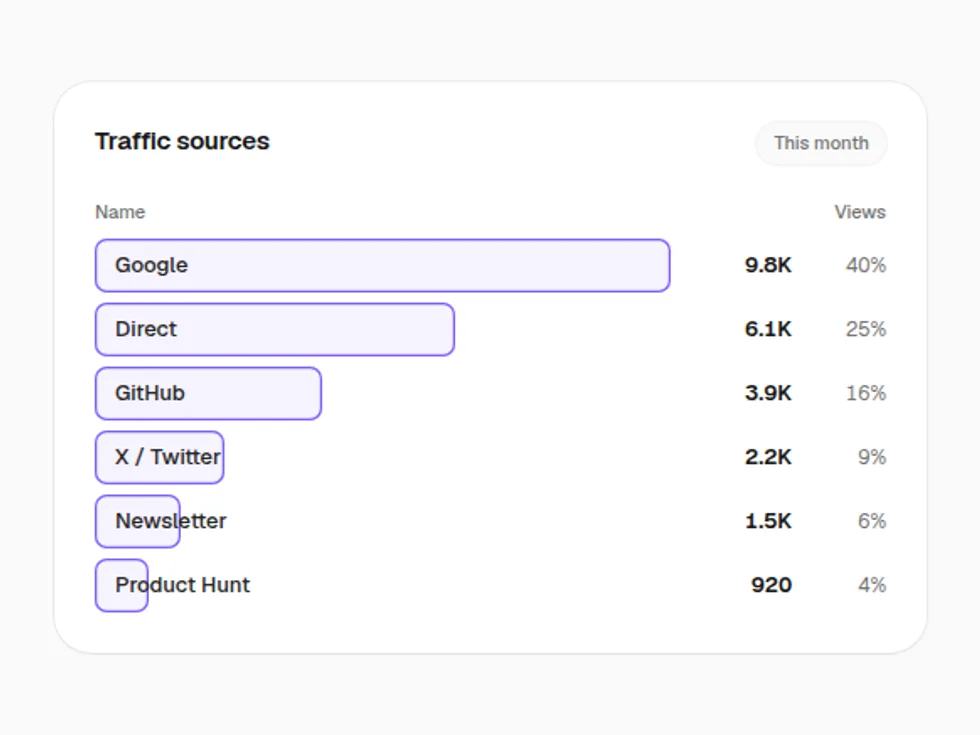

Outlined Horizontal Bar Chart
ChartA ranked list of bars that slide out one after another, label inside and value at the end — hairline outlines over a faint tint.
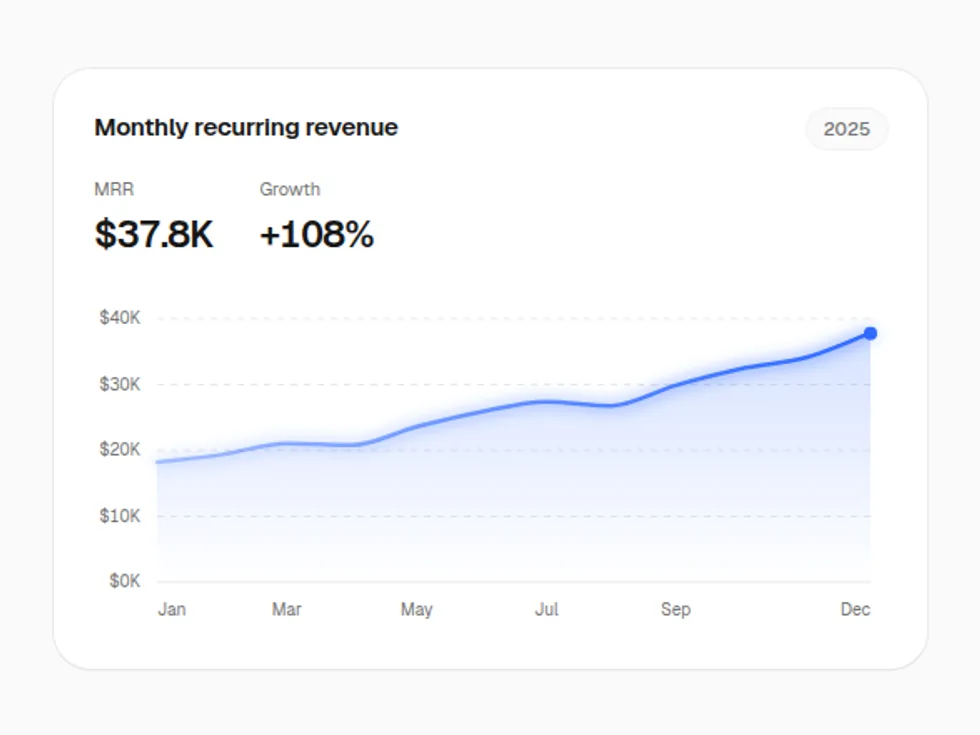
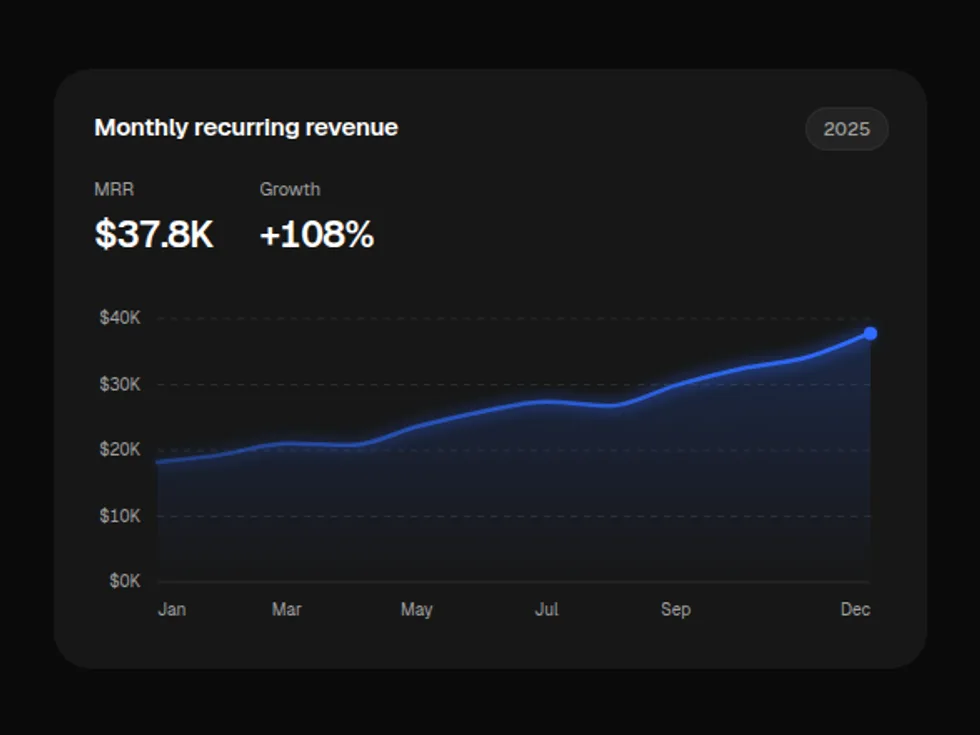
Gradient Line Chart
ChartSmooth lines that draw in from the left, with a crosshair tooltip across every series — soft gradient fills that fade into the floor.
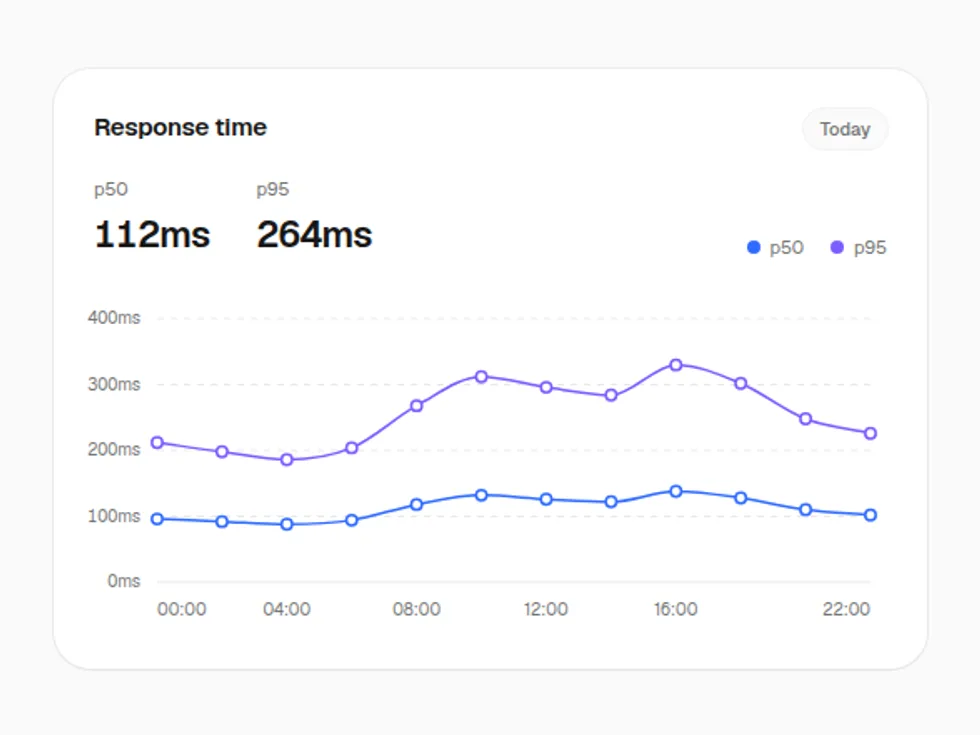
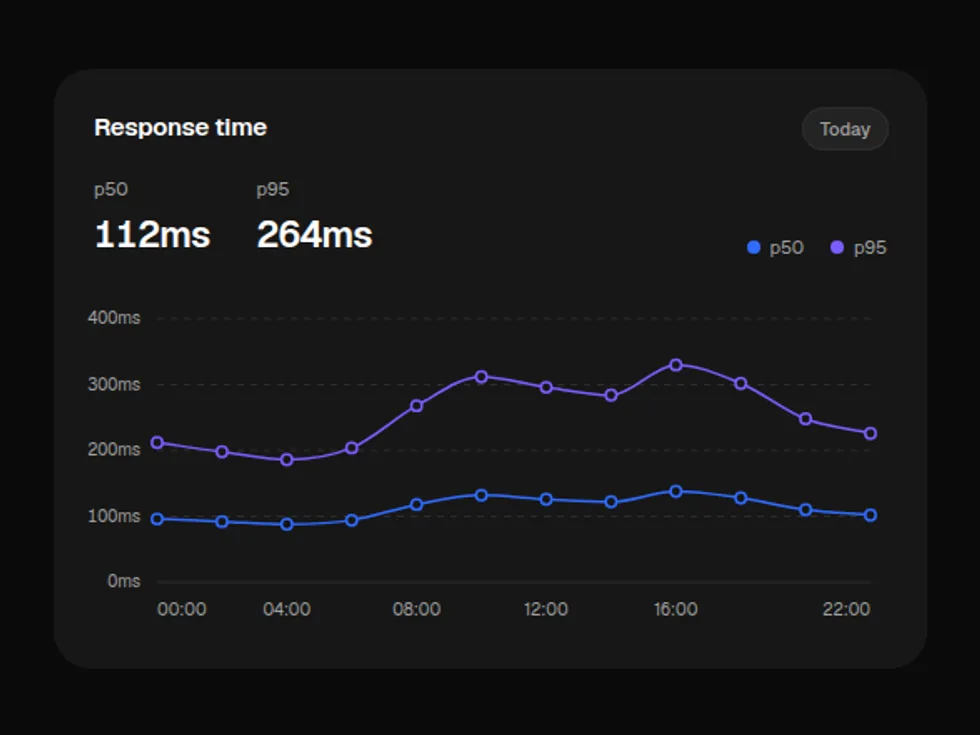
Outlined Line Chart
ChartSmooth lines that draw in from the left, with a crosshair tooltip across every series — hairline outlines over a faint tint.
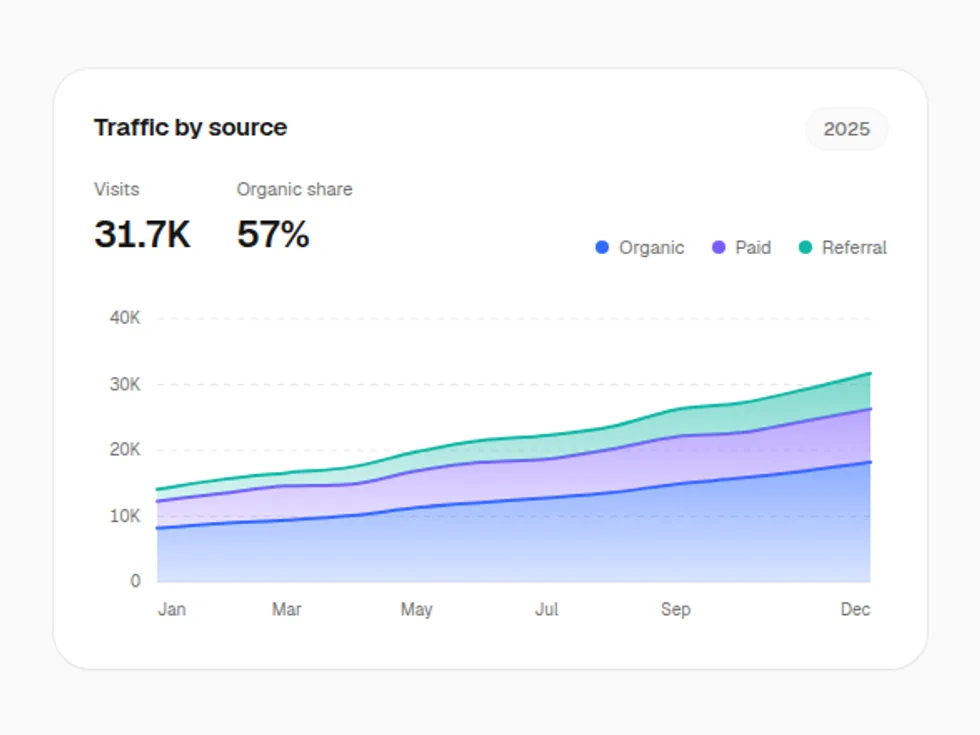
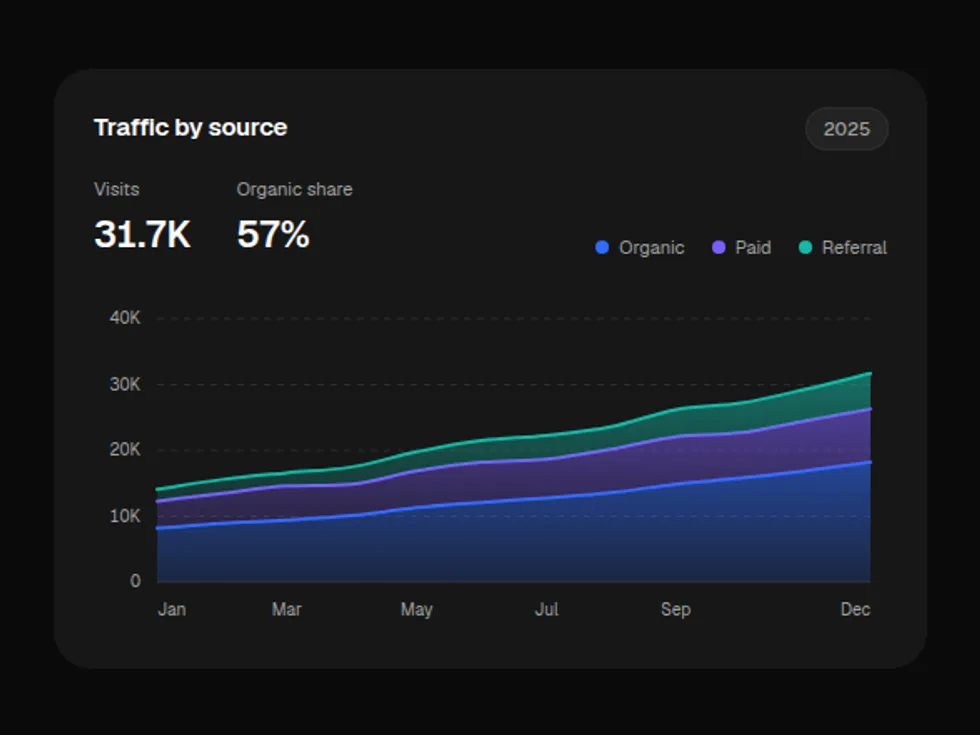
Gradient Area Chart
ChartFilled trends that sweep in from the left, overlapping or stacked, with a crosshair tooltip — soft gradient fills that fade into the floor.
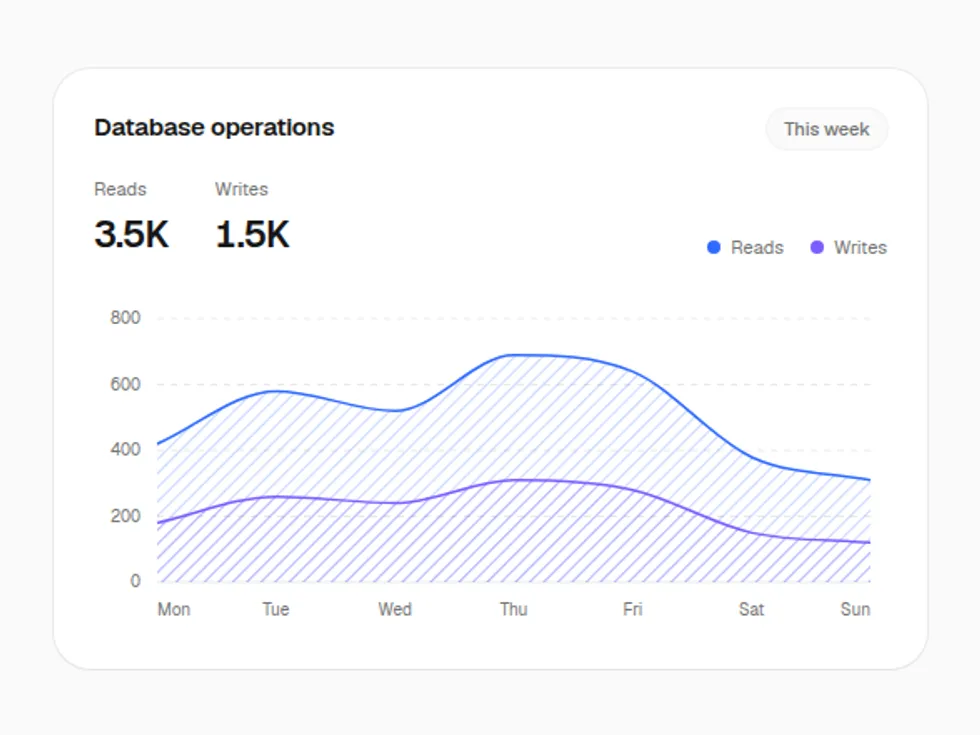
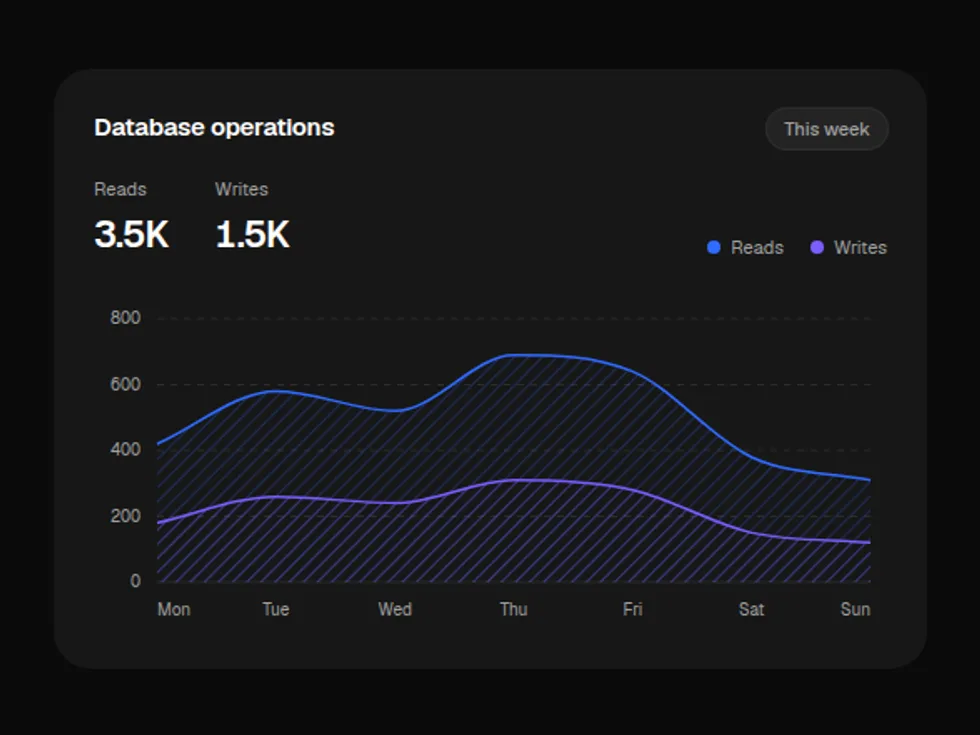
Outlined Area Chart
ChartFilled trends that sweep in from the left, overlapping or stacked, with a crosshair tooltip — hairline outlines over a faint tint.
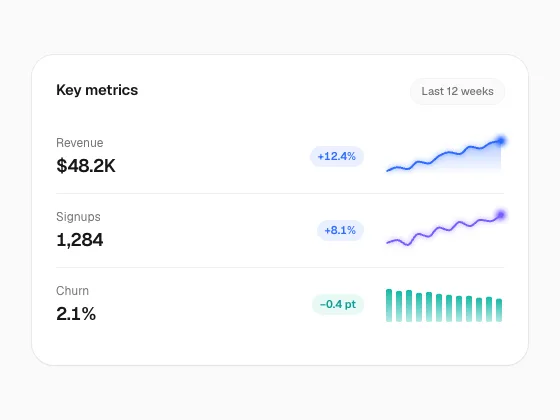
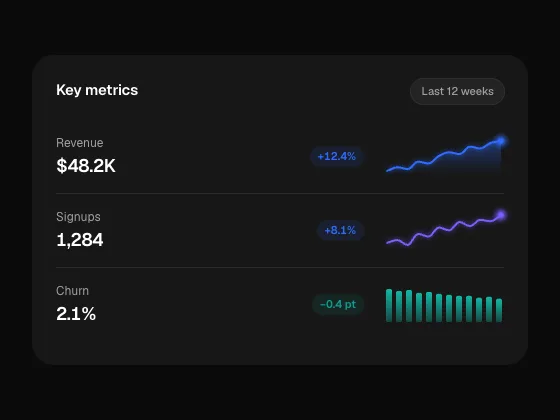
Gradient Spark Chart
ChartWord-sized line, area or bar trends for stat cards and table rows — soft gradient fills that fade into the floor.


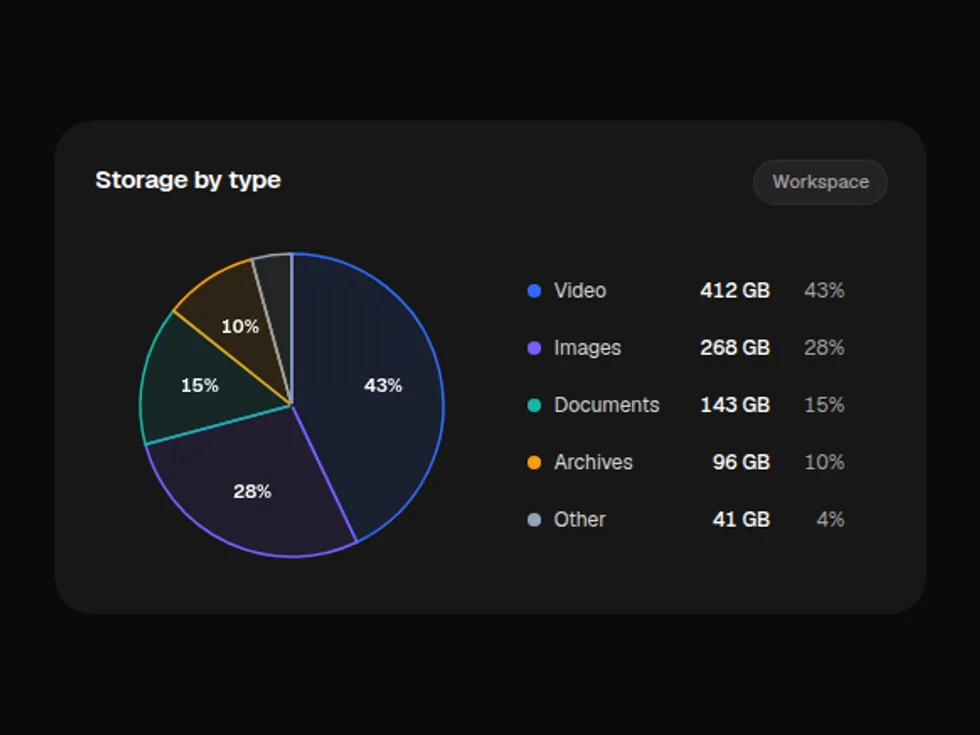
Gradient Pie Chart
ChartWedges with thin gaps that sweep in clockwise; hovering pops a wedge outward — soft gradient fills that fade into the floor.
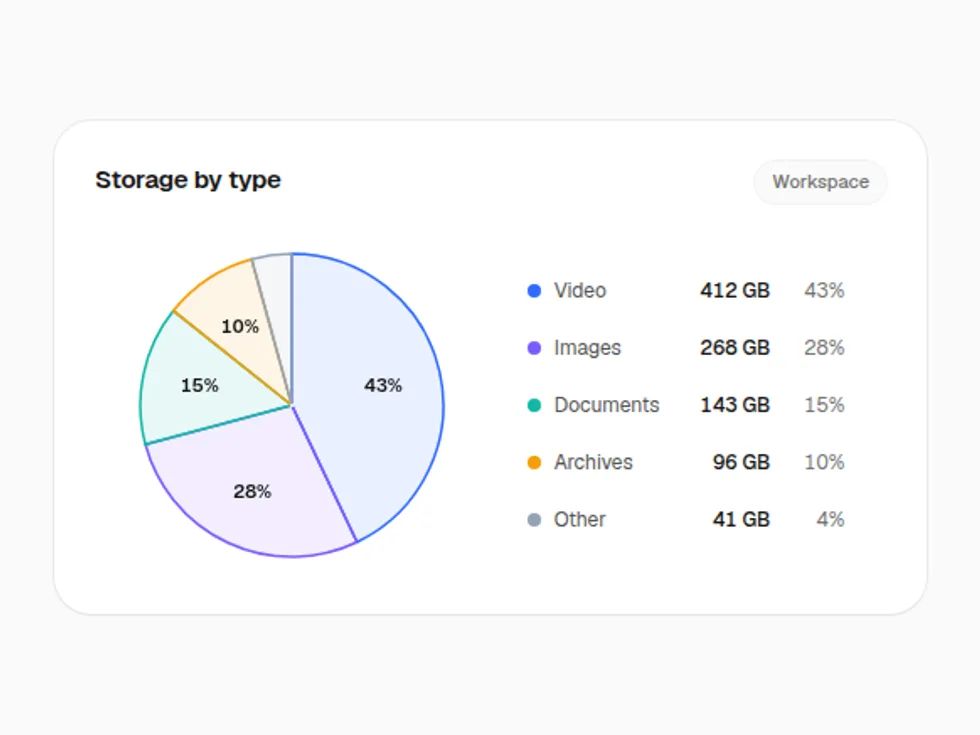
Outlined Pie Chart
ChartWedges with thin gaps that sweep in clockwise; hovering pops a wedge outward — hairline outlines over a faint tint.


Gradient Donut Chart
ChartA ring or semi-circle gauge of rounded segments that sweep in one after another, with the hovered value in the middle — soft gradient fills that fade into the floor.

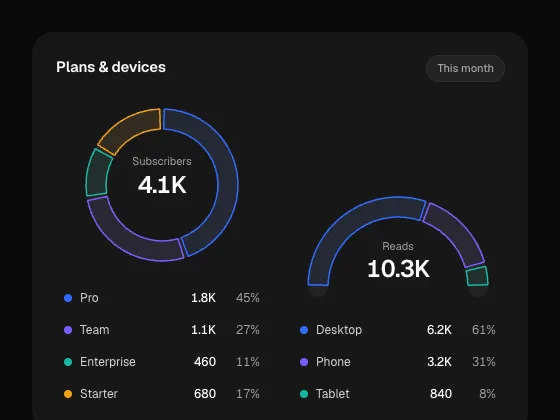
Outlined Donut Chart
ChartA ring or semi-circle gauge of rounded segments that sweep in one after another, with the hovered value in the middle — hairline outlines over a faint tint.

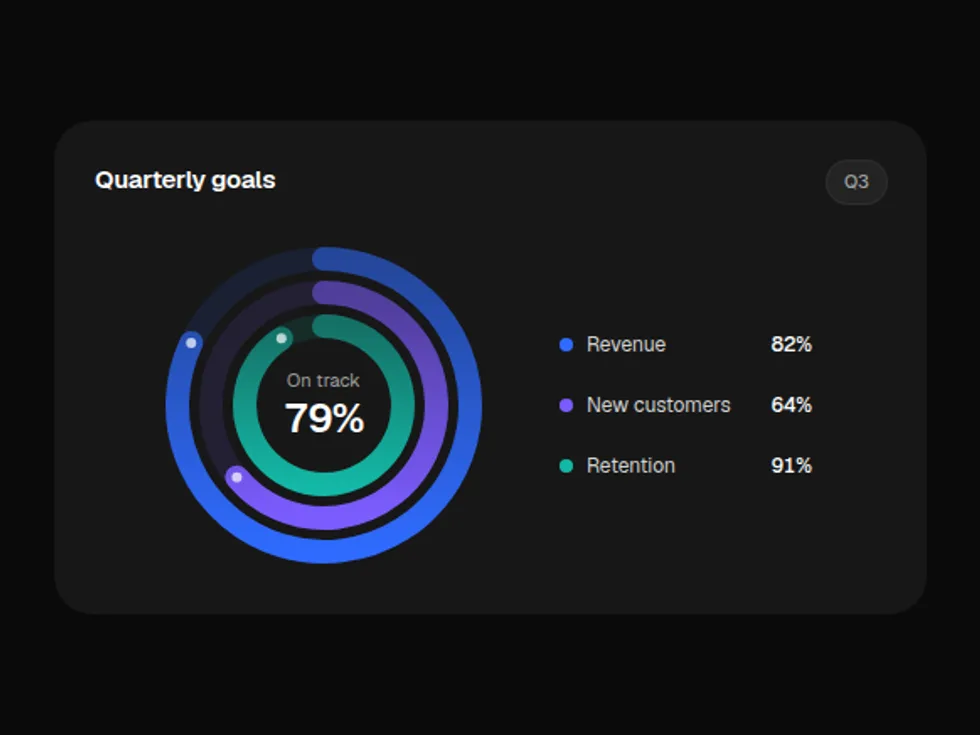
Gradient Radial Chart
ChartConcentric progress rings that fill clockwise one after another, with a centre readout and legend — soft gradient fills that fade into the floor.
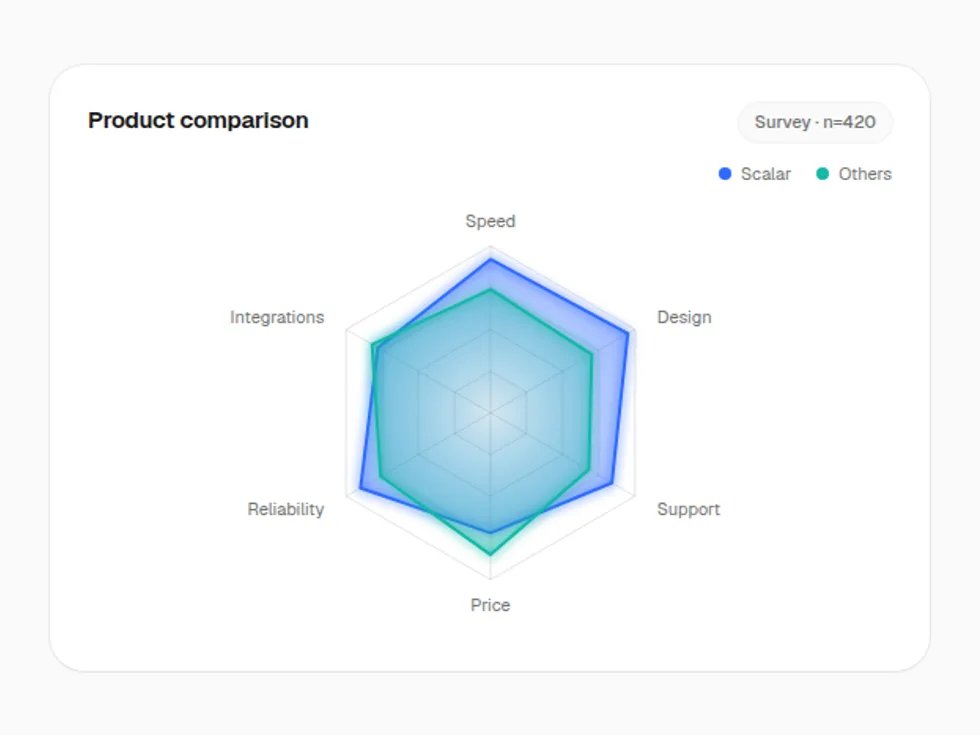
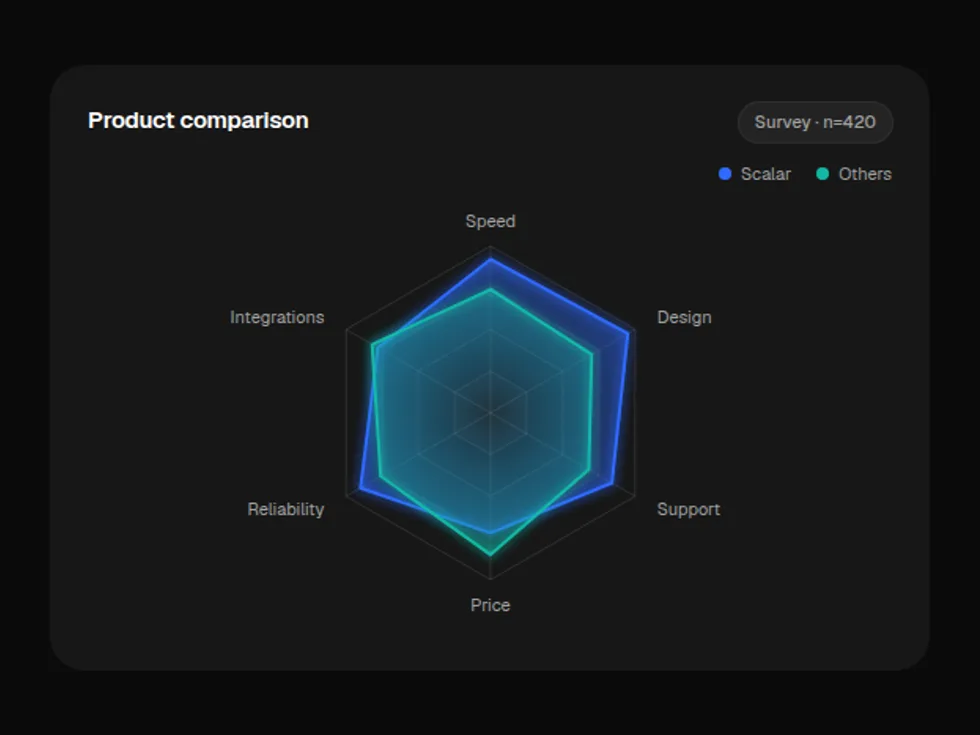
Gradient Hexagon Chart
ChartA radar chart on a hexagonal grid; each series grows out of the centre — soft gradient fills that fade into the floor.
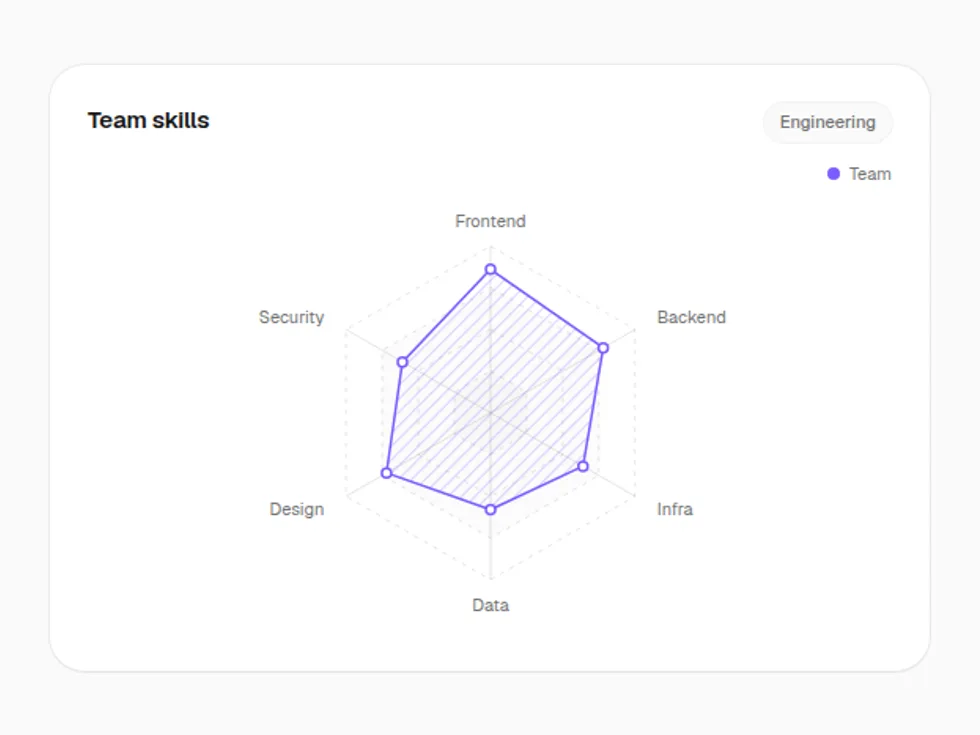
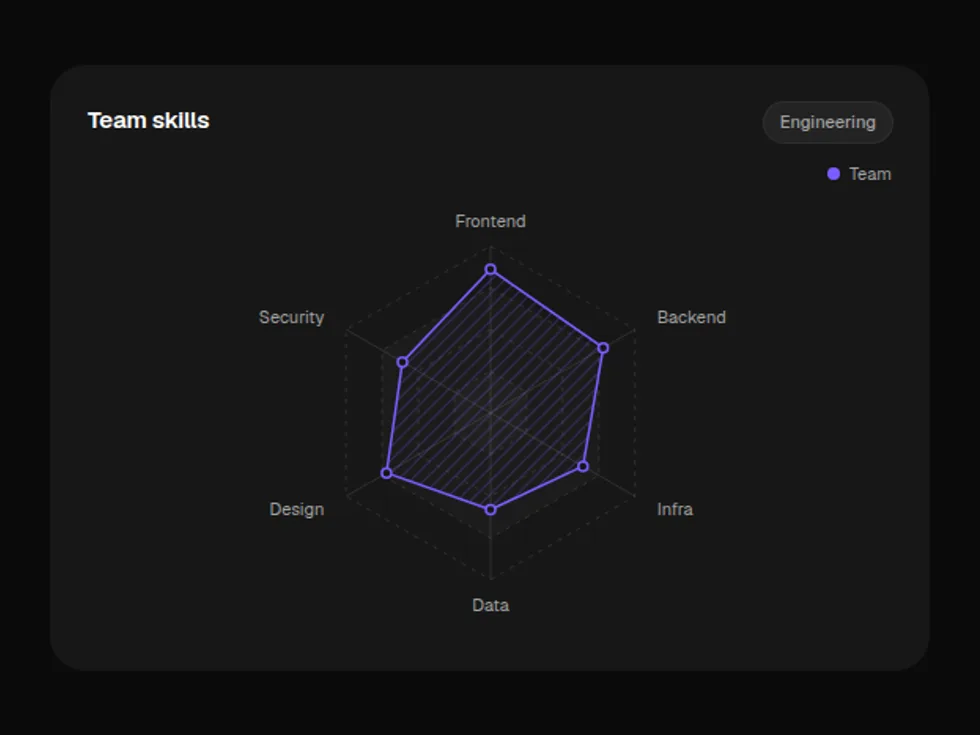
Outlined Hexagon Chart
ChartA radar chart on a hexagonal grid; each series grows out of the centre — hairline outlines over a faint tint.
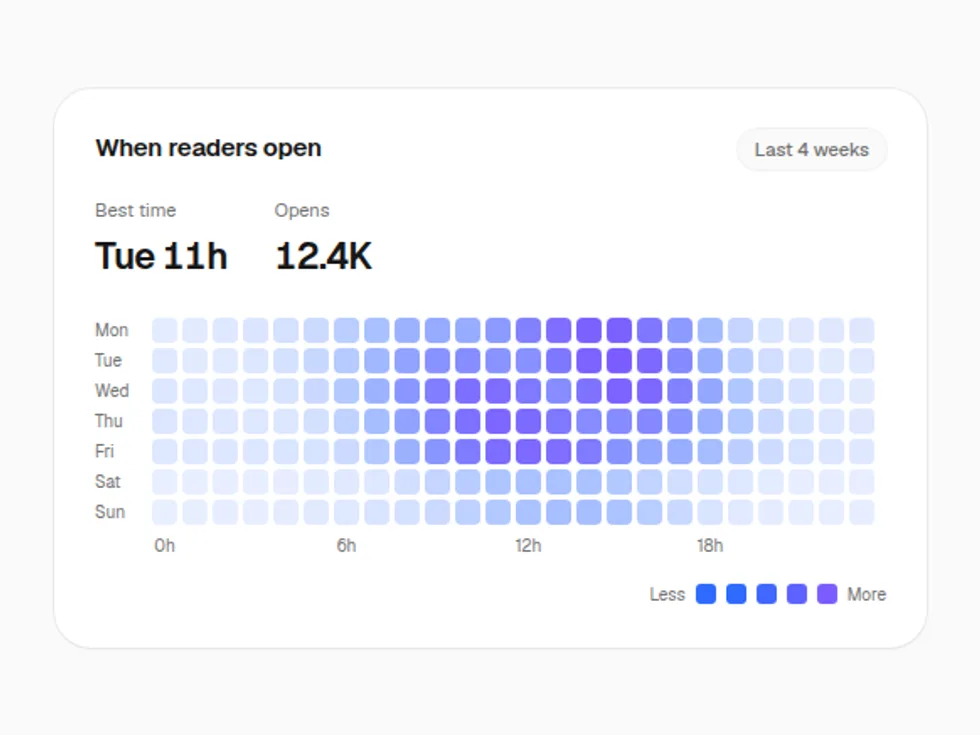
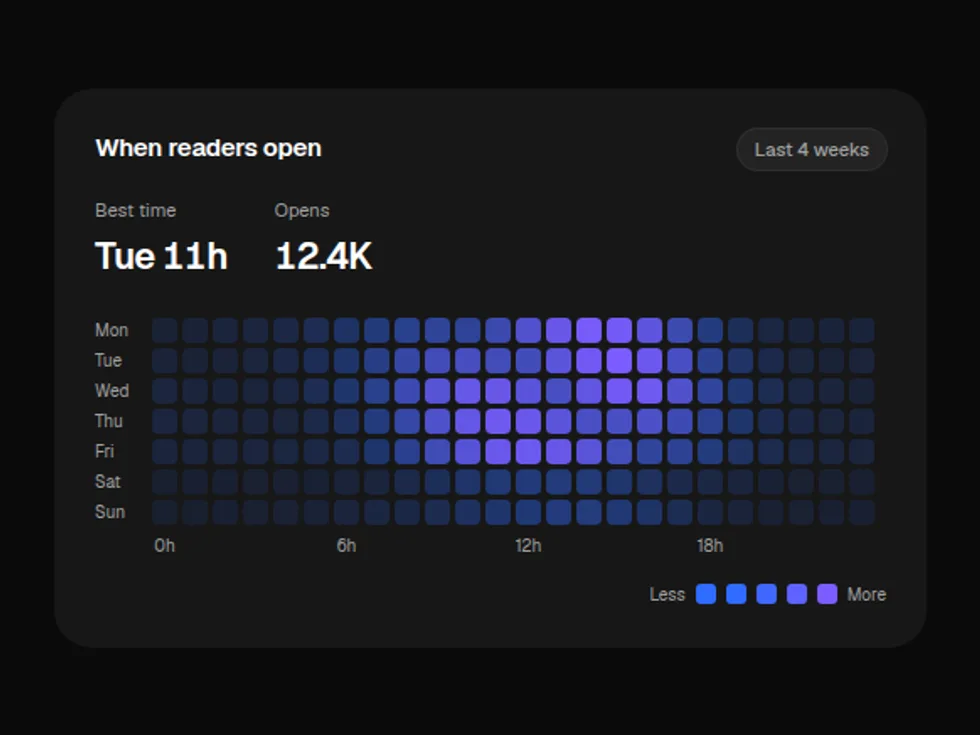
Gradient Heatmap
ChartA grid shaded by value that cascades in diagonally, with a row-and-column crosshair on hover — soft gradient fills that fade into the floor.
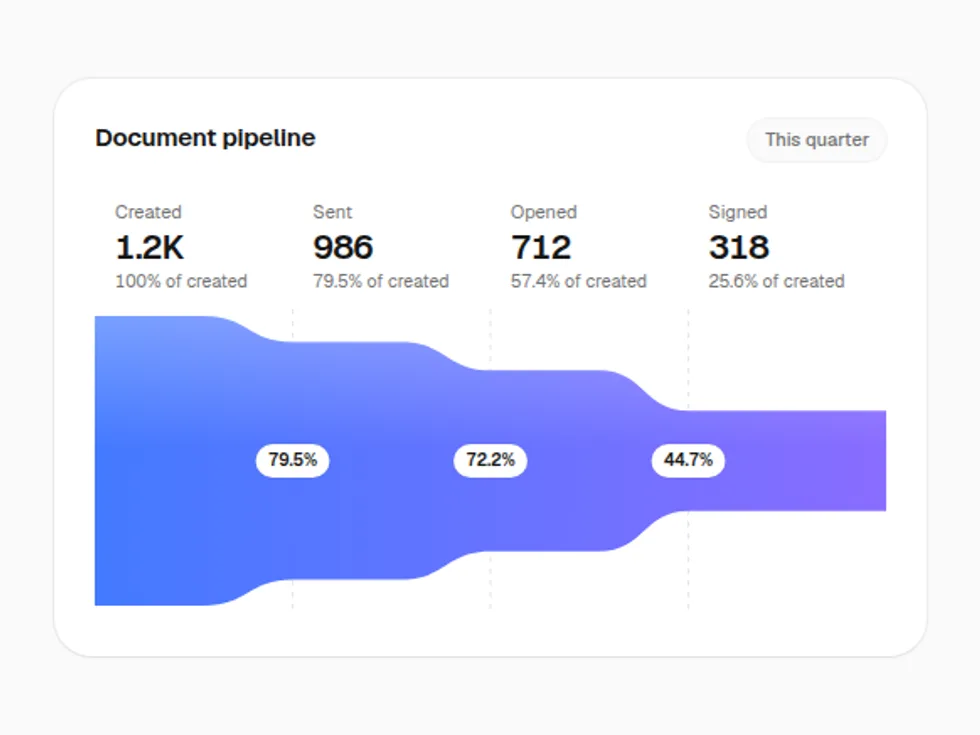
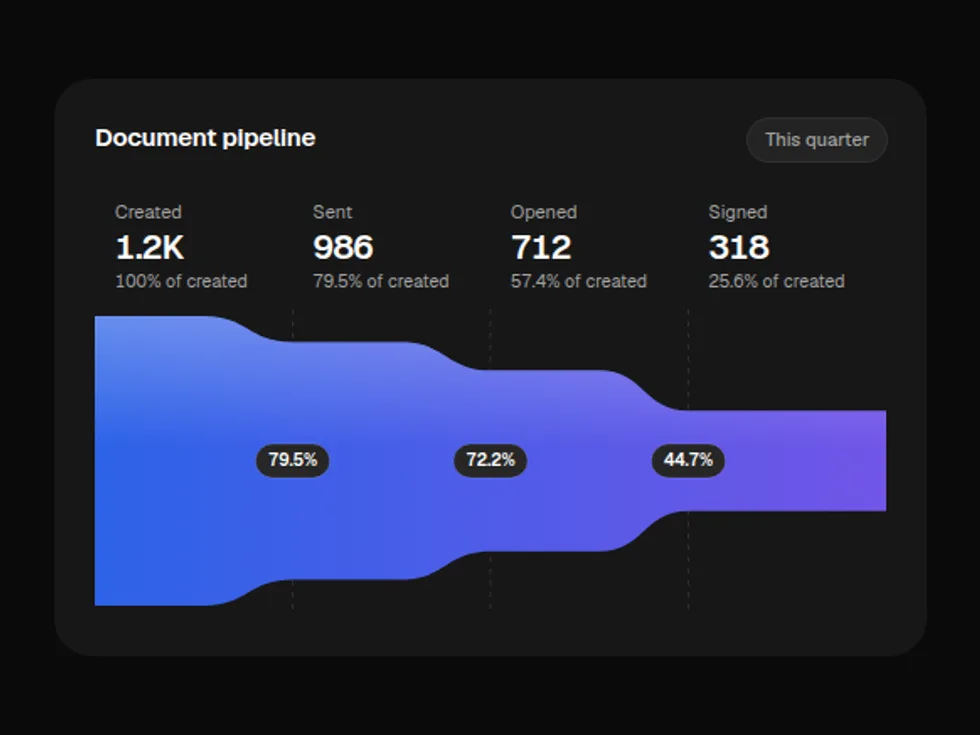
Gradient Funnel Chart
ChartOne band that narrows stage by stage, with counts, shares and step-conversion pills — soft gradient fills that fade into the floor.
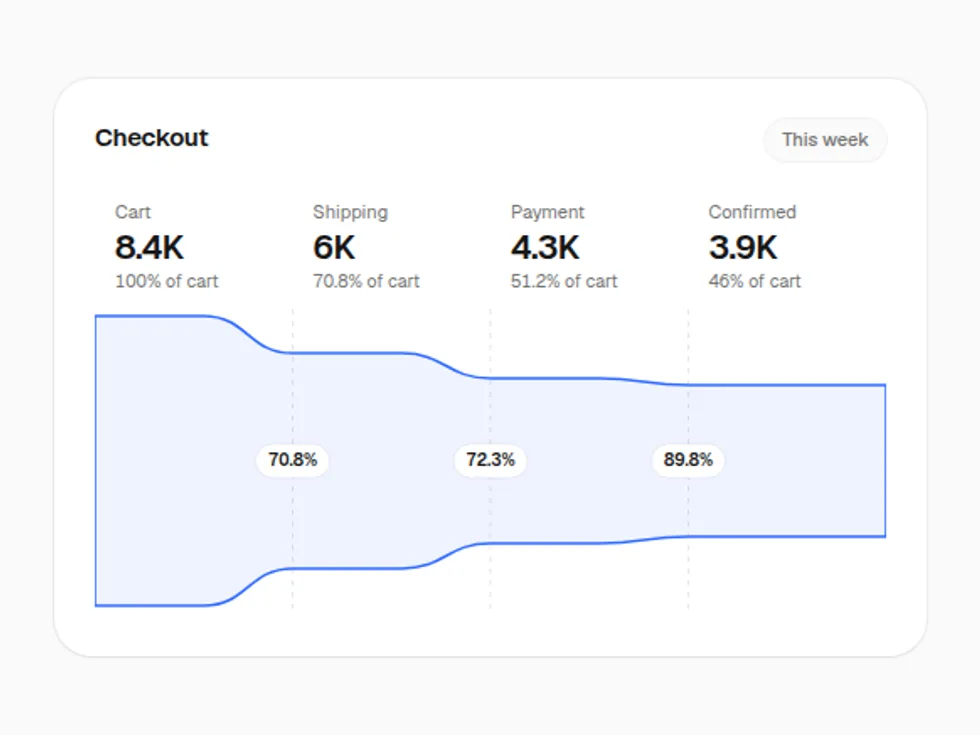
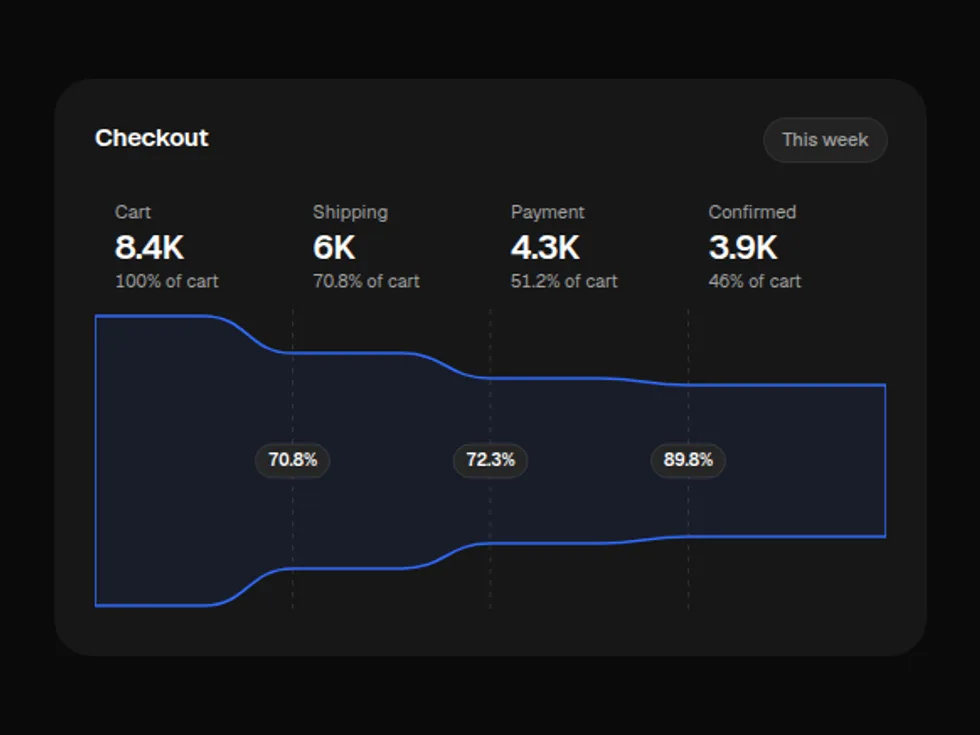
Outlined Funnel Chart
ChartOne band that narrows stage by stage, with counts, shares and step-conversion pills — hairline outlines over a faint tint.
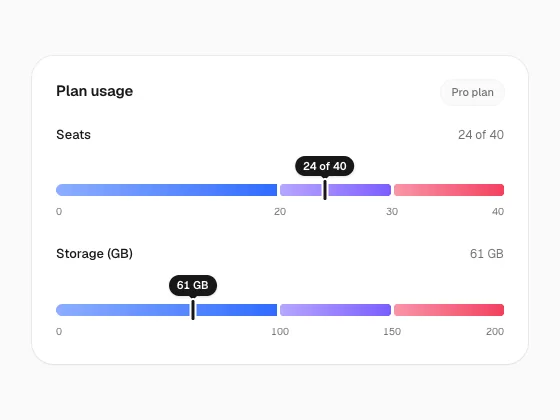
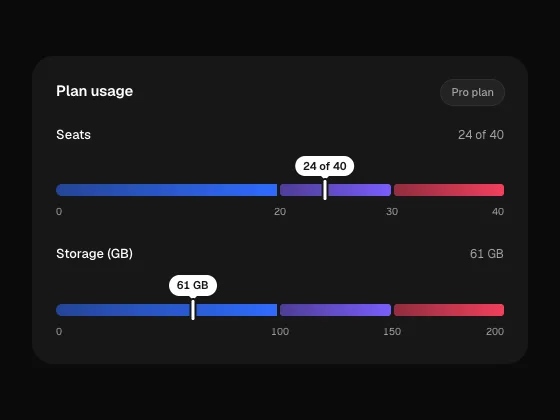
Gradient Category Bar
ChartOne bar divided into coloured ranges, with a marker that slides to the current value — soft gradient fills that fade into the floor.
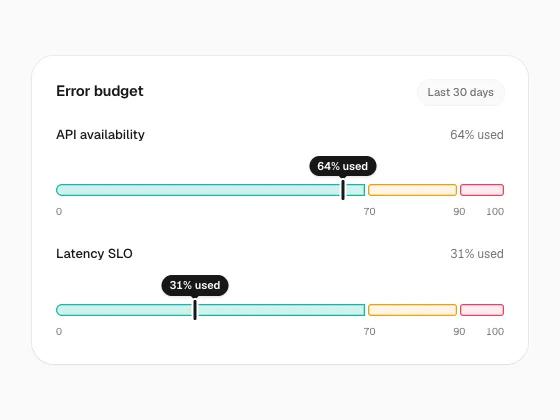
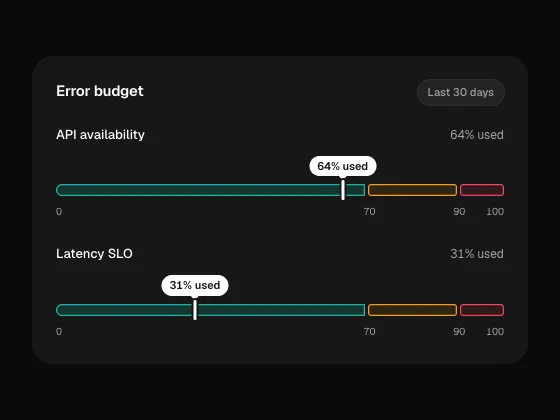
Outlined Category Bar
ChartOne bar divided into coloured ranges, with a marker that slides to the current value — hairline outlines over a faint tint.
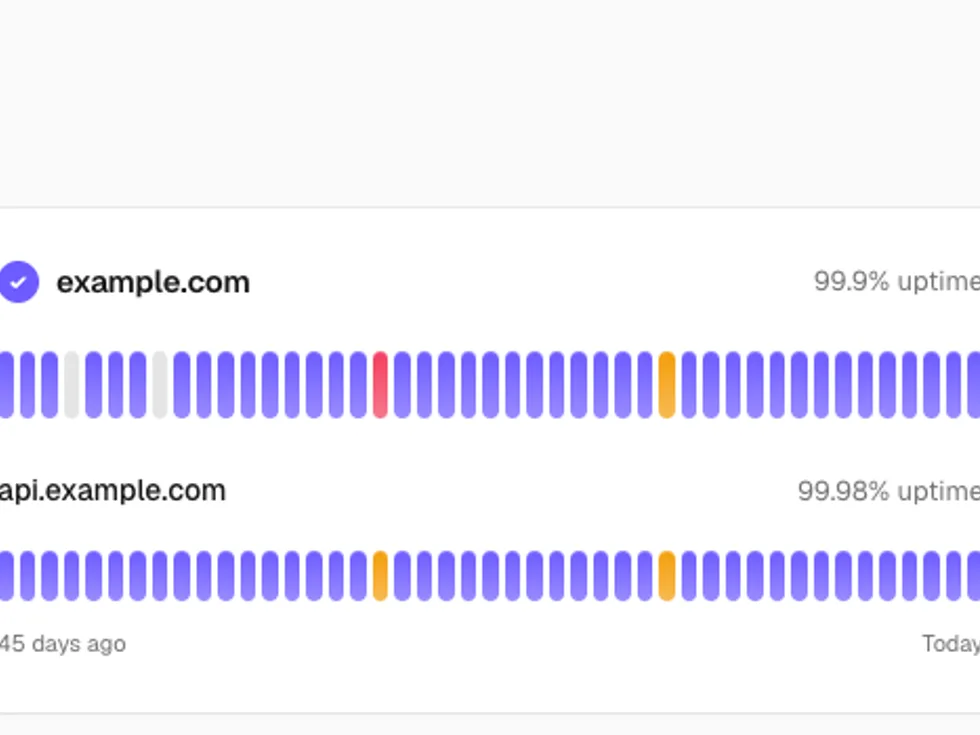
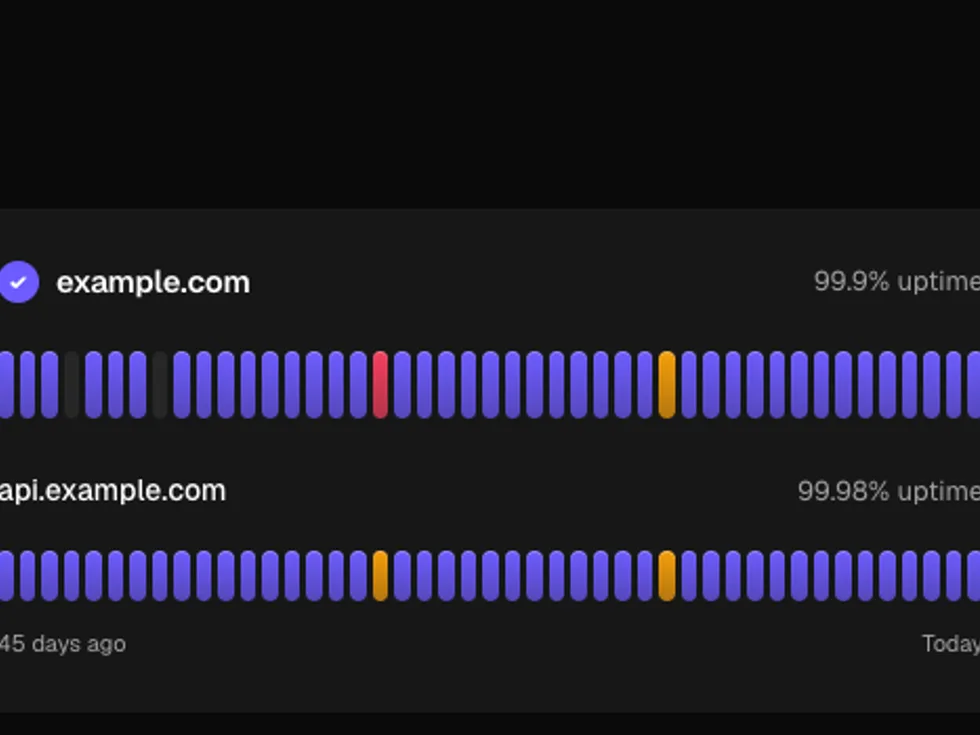
Gradient Segmented Progress
ChartA row of status blocks — uptime, streaks, steps — that pop up left to right with tooltips — soft gradient fills that fade into the floor.
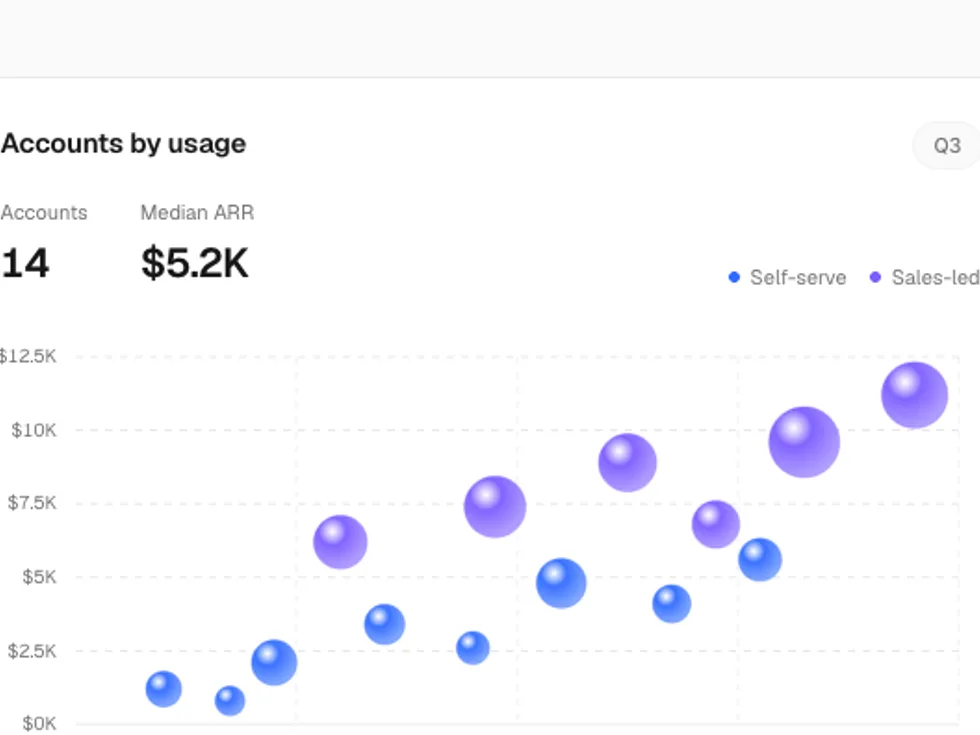
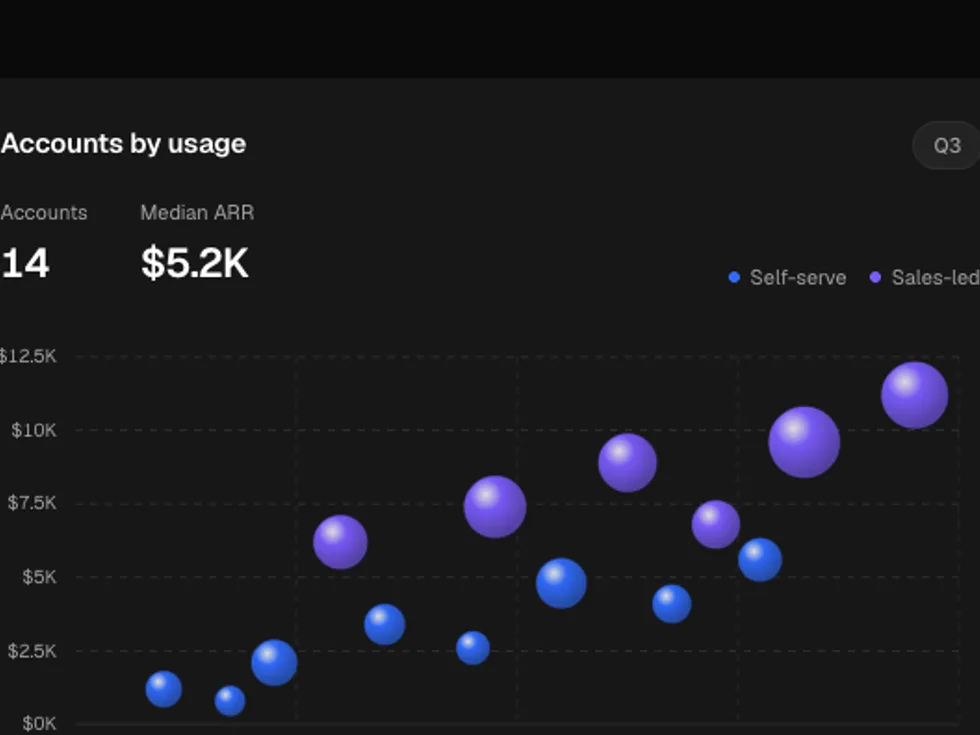
Gradient Scatter Chart
ChartPoints or bubbles that pop in left to right on a dashed grid; hovering finds the nearest point and drops guides to both axes — soft gradient fills that fade into the floor.
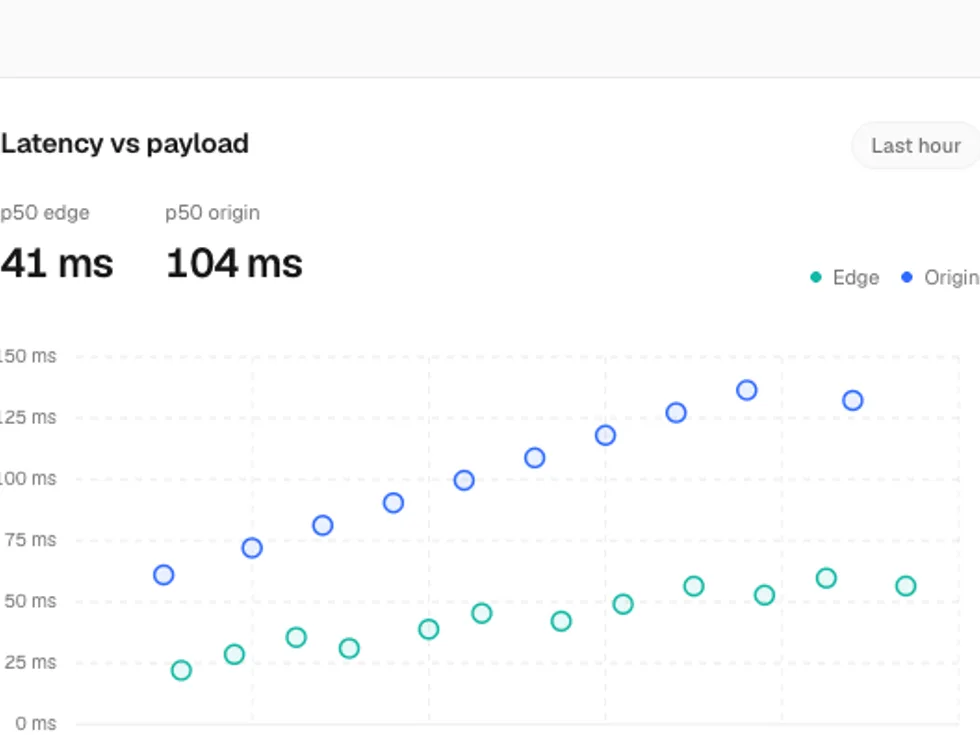
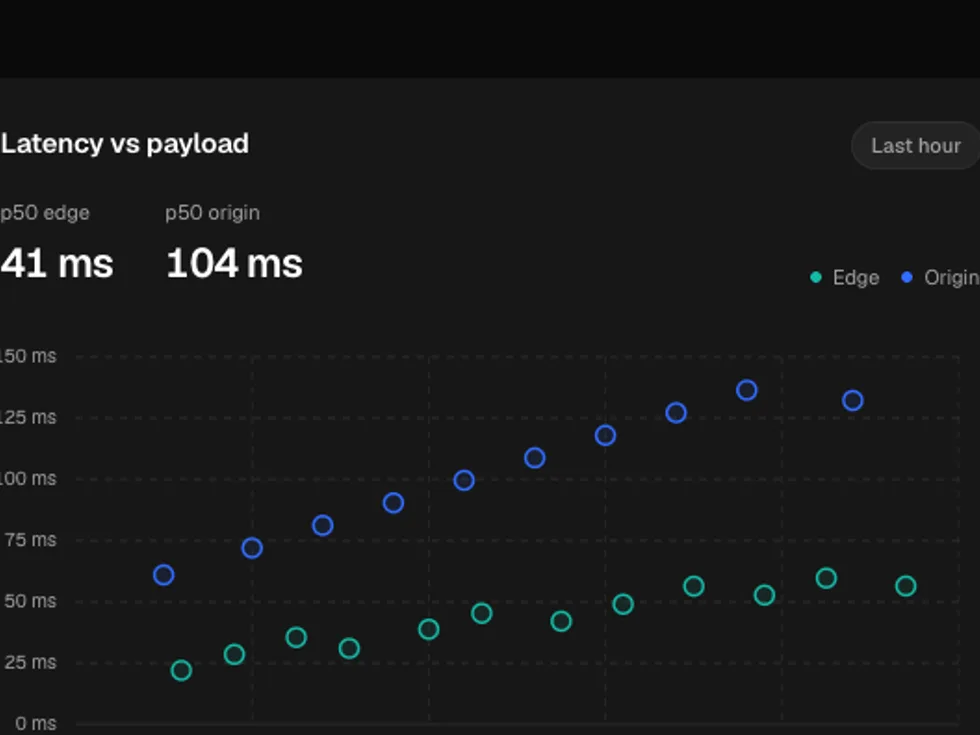
Outlined Scatter Chart
ChartPoints or bubbles that pop in left to right on a dashed grid; hovering finds the nearest point and drops guides to both axes — hairline outlines over a faint tint.
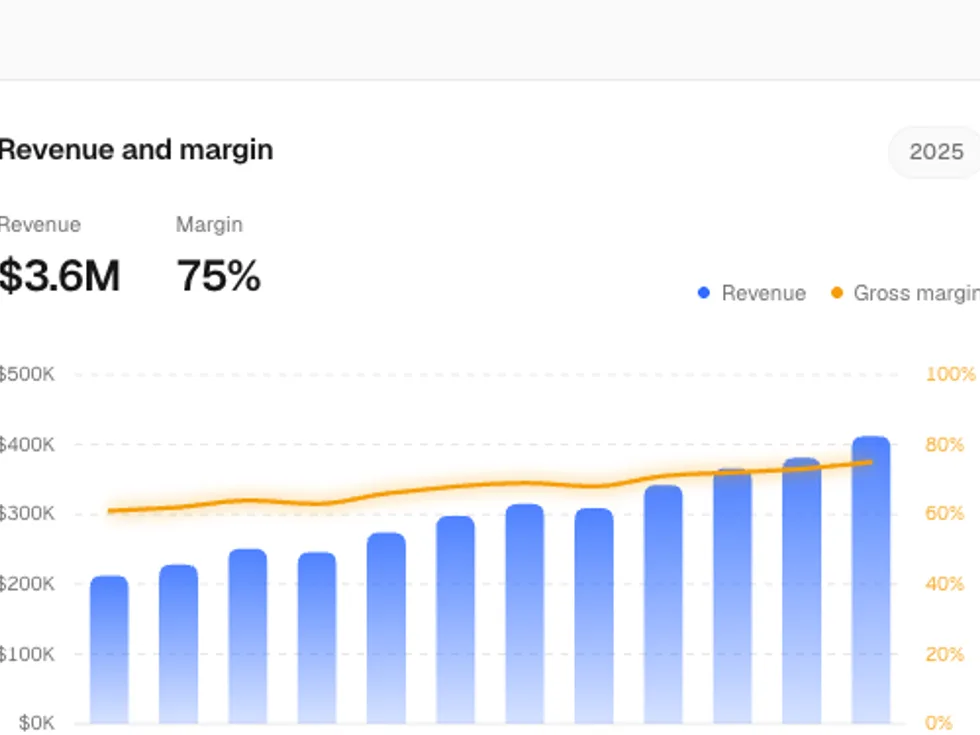
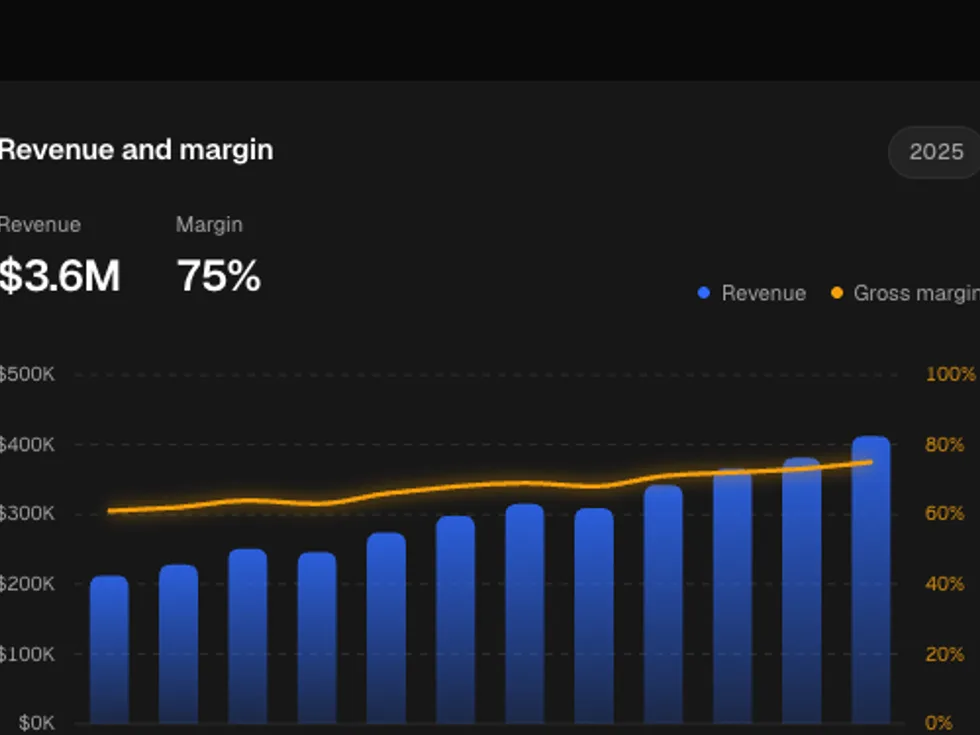
Gradient Combo Chart
ChartColumns and a smooth line on their own axes; columns spring up, then the line draws across them, and hovering lists both — soft gradient fills that fade into the floor.
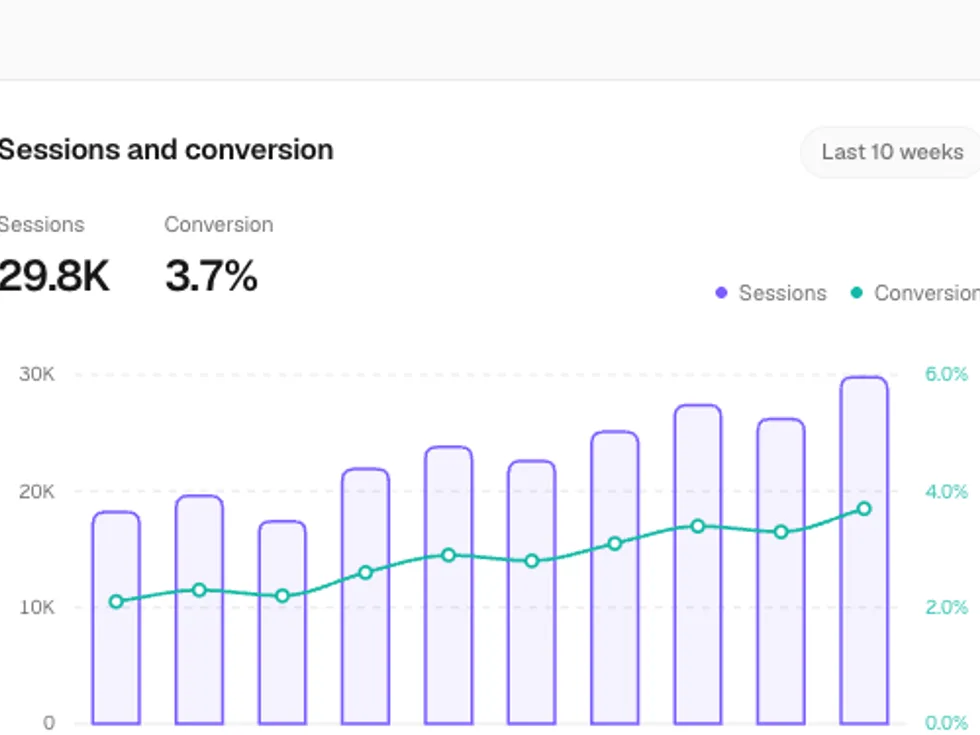
Outlined Combo Chart
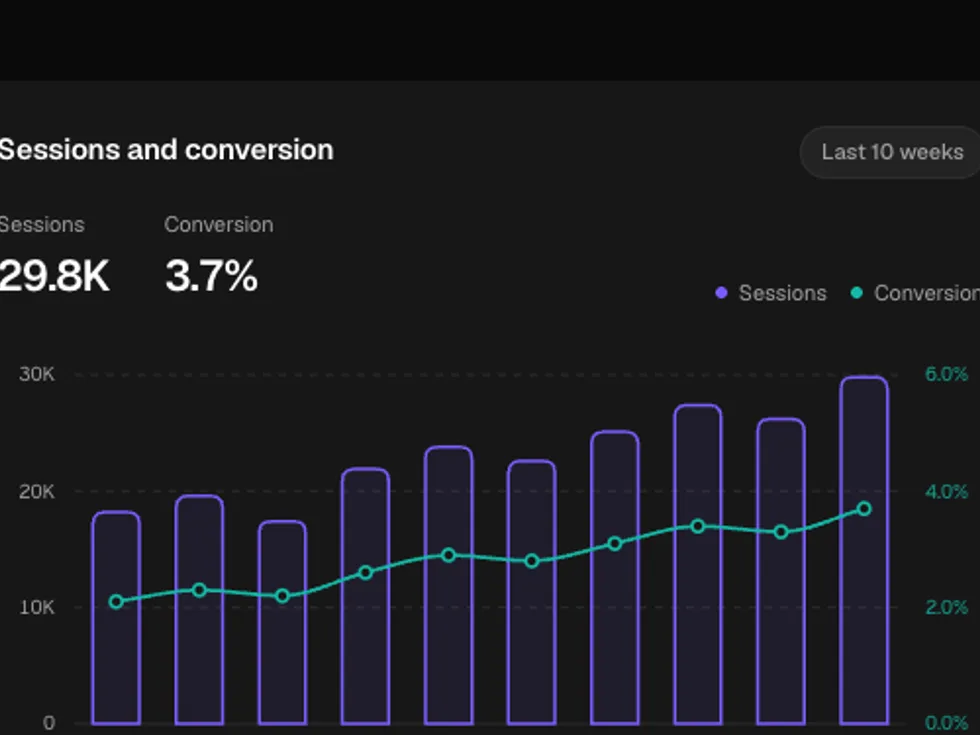
ChartColumns and a smooth line on their own axes; columns spring up, then the line draws across them, and hovering lists both — hairline outlines over a faint tint.
Gradient Waterfall Chart
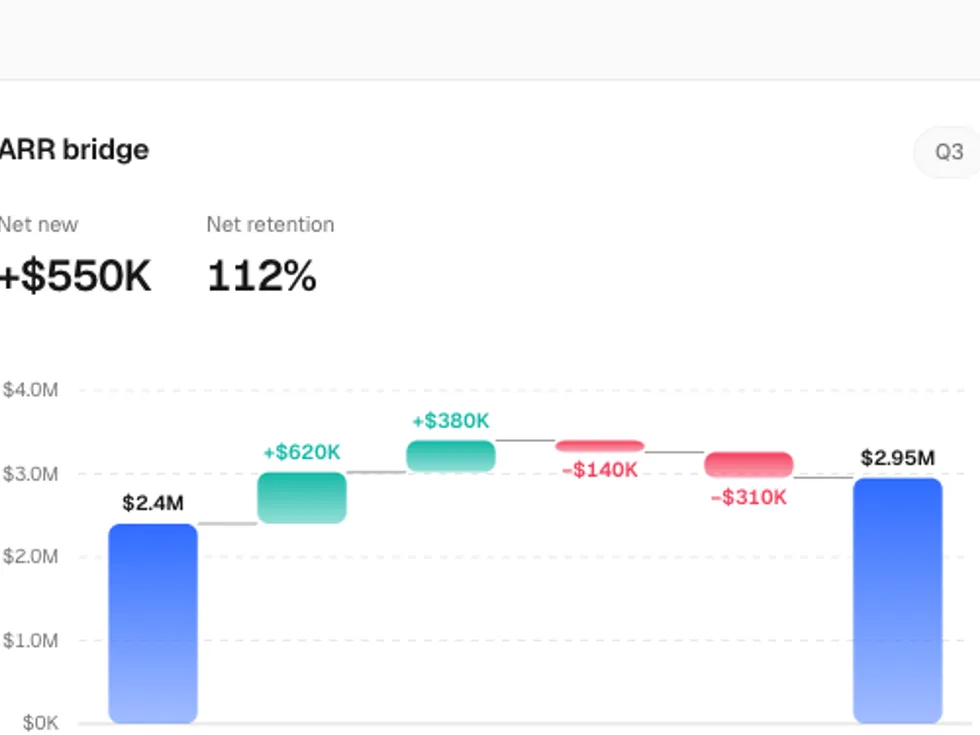
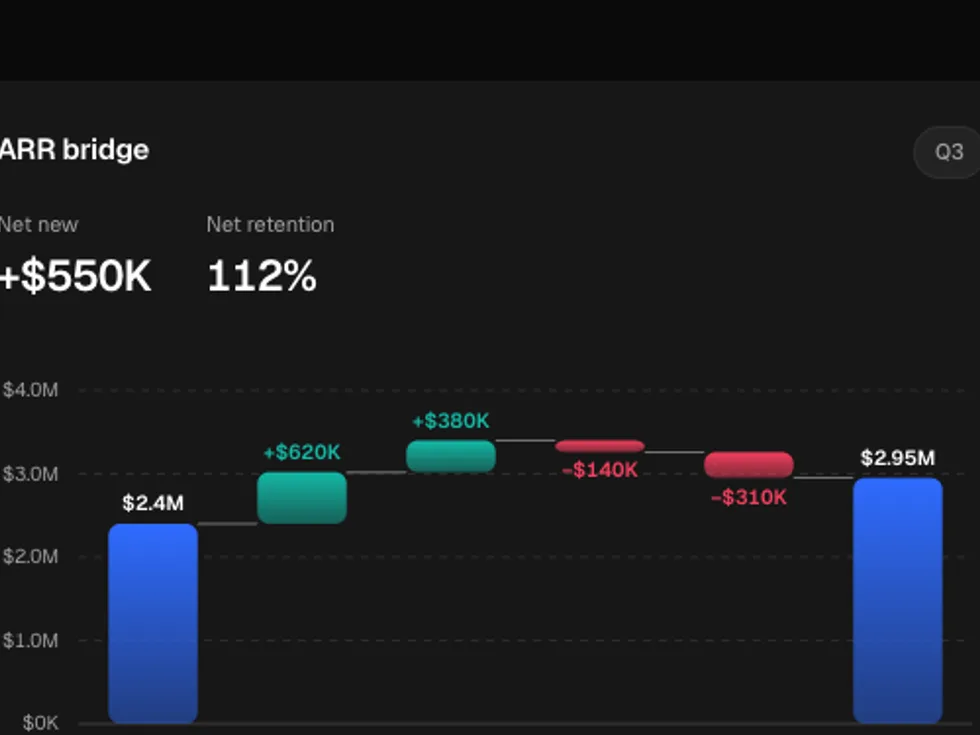
ChartChanges that float from the running total, joined by dashed connectors, with totals on the floor; columns grow in one after another — soft gradient fills that fade into the floor.
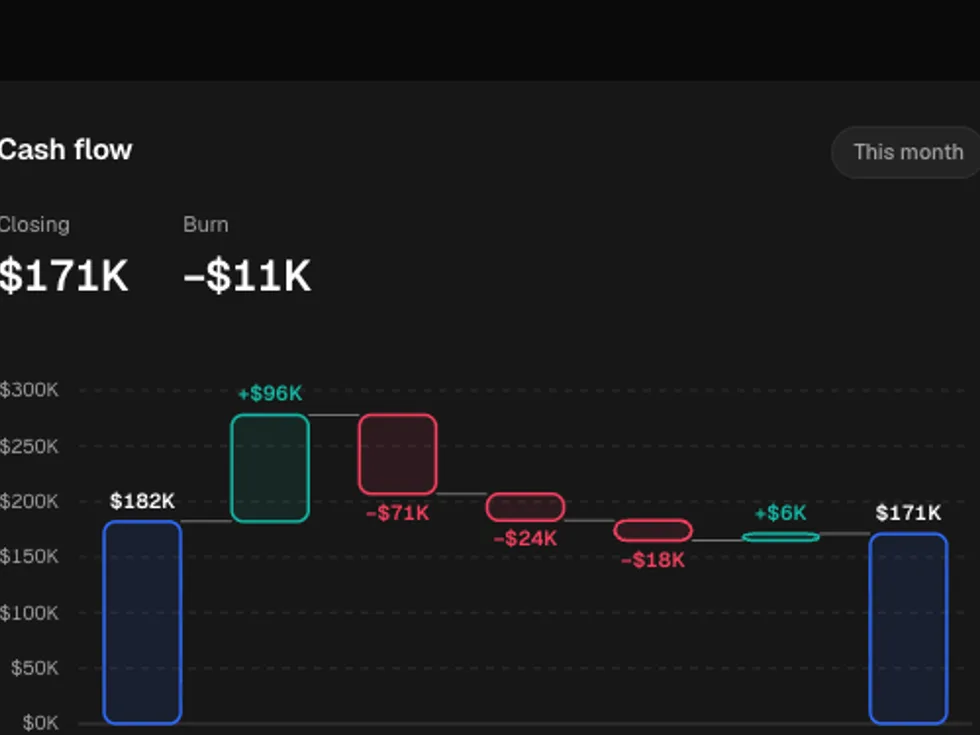
Outlined Waterfall Chart
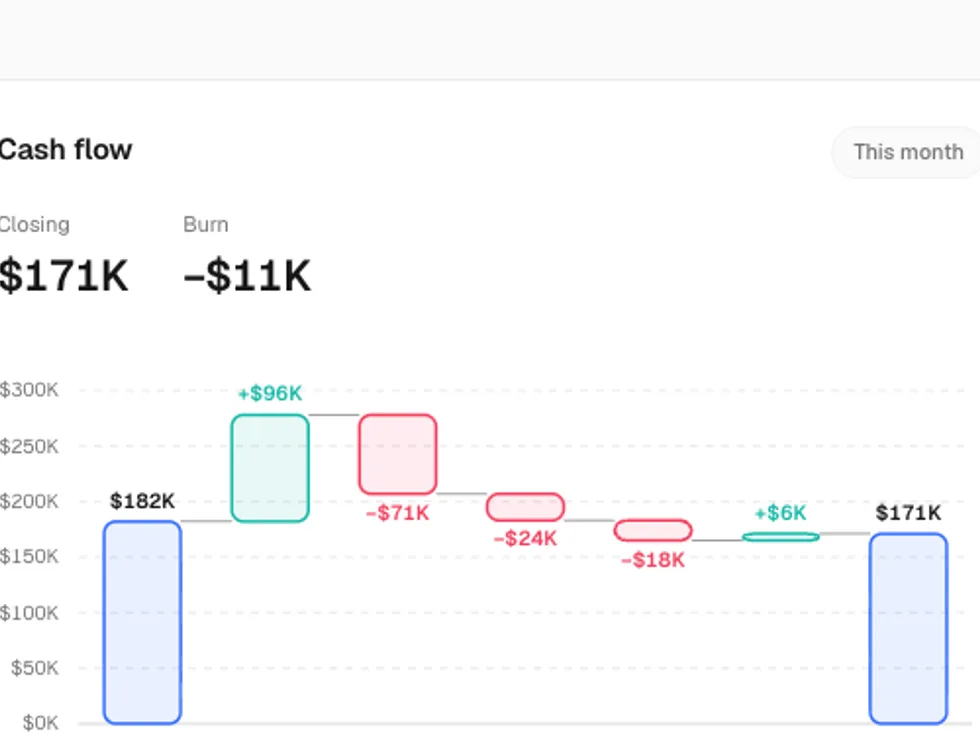
ChartChanges that float from the running total, joined by dashed connectors, with totals on the floor; columns grow in one after another — hairline outlines over a faint tint.
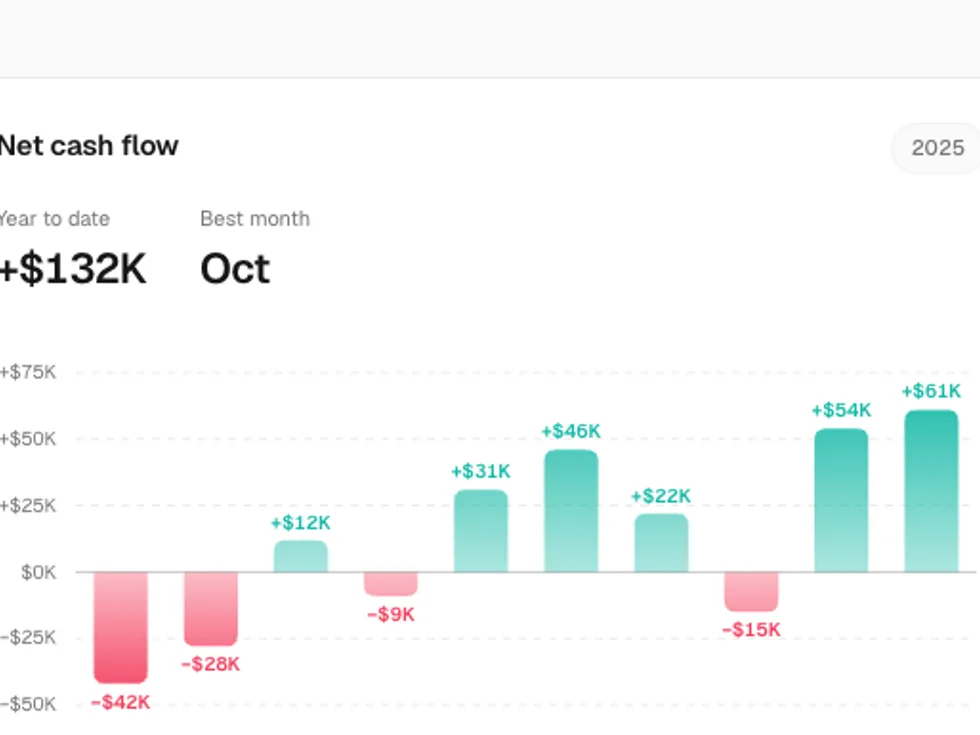
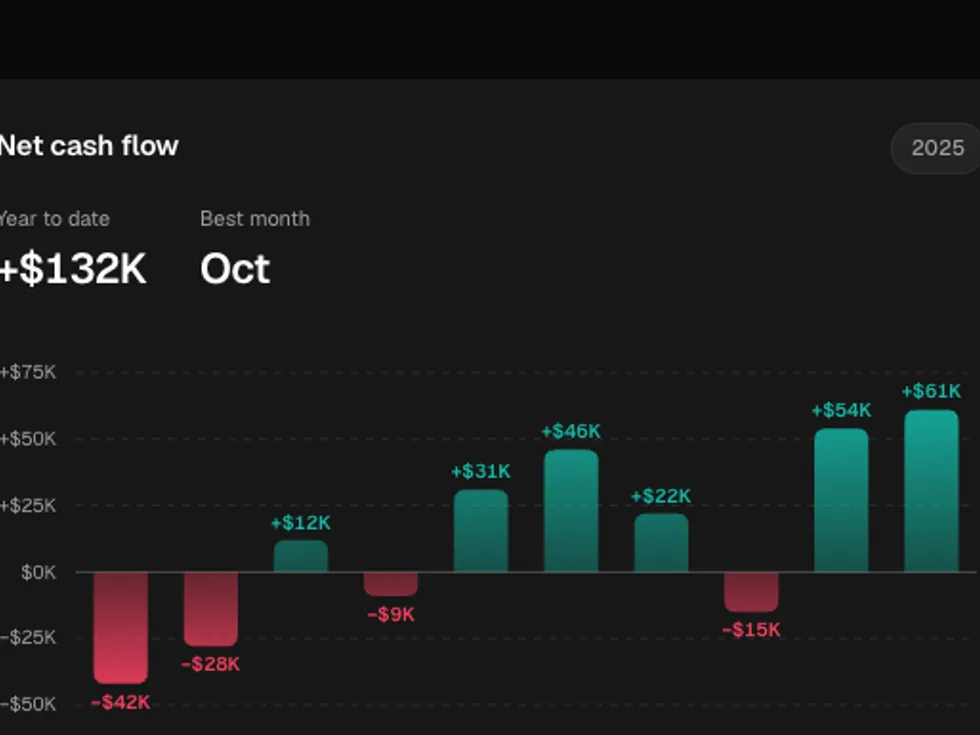
Gradient Diverging Bar Chart
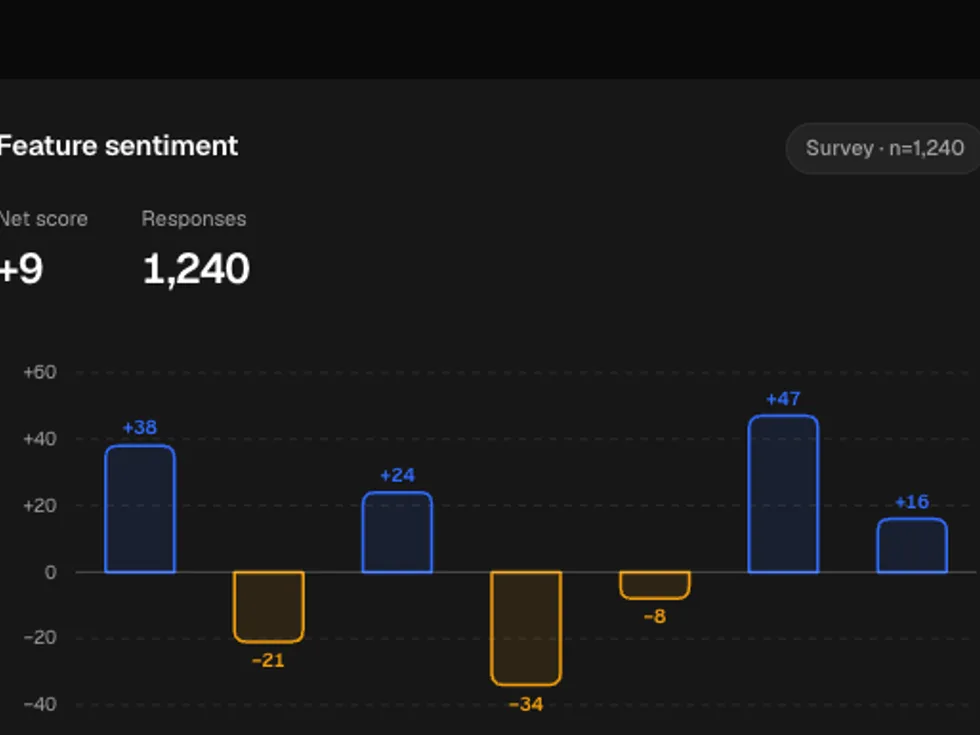
ChartColumns that grow up or down from a zero line in their own colours, with signed values at their ends — soft gradient fills that fade into the floor.
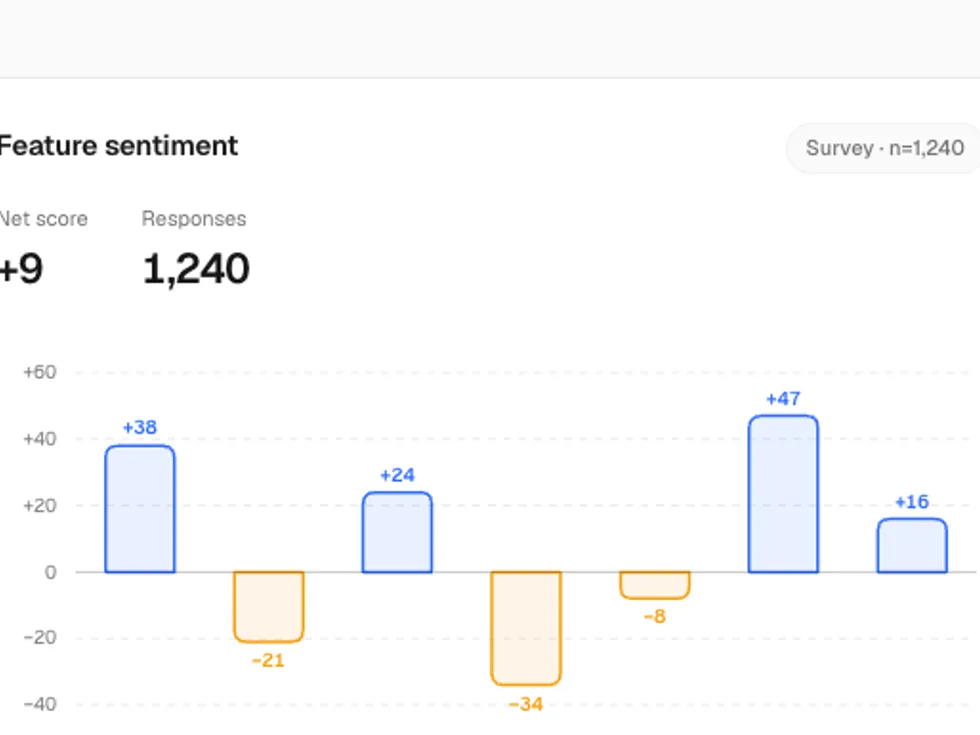
Outlined Diverging Bar Chart
ChartColumns that grow up or down from a zero line in their own colours, with signed values at their ends — hairline outlines over a faint tint.

Gradient Candlestick Chart
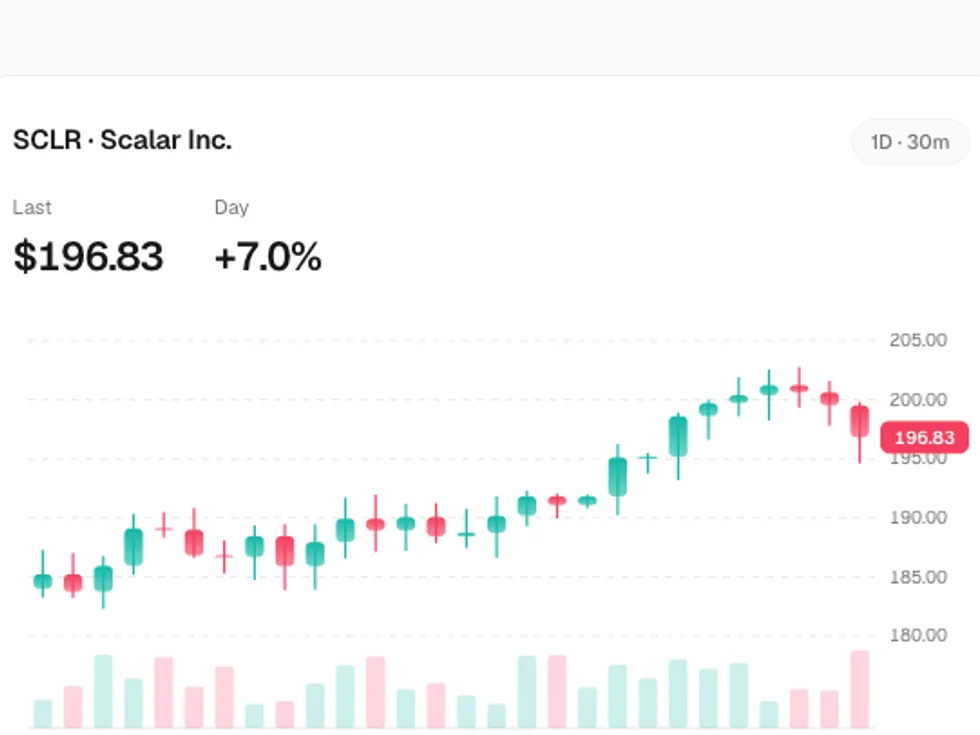
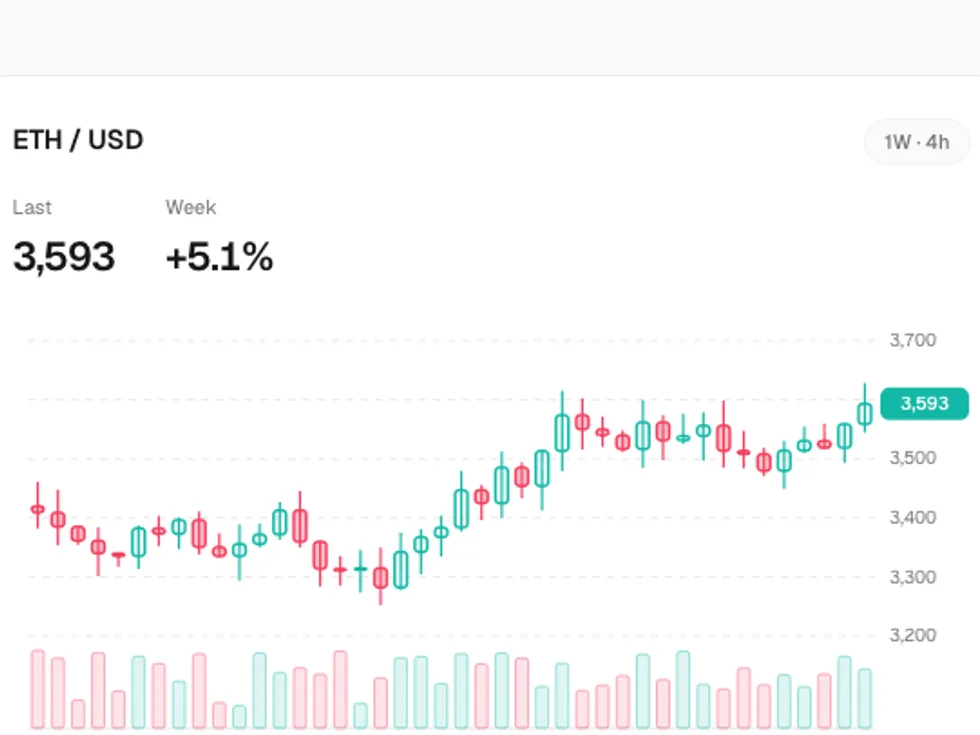
ChartOpen, high, low and close per period with volume underneath; candles open from their midpoint, and hovering draws a crosshair and tags the close — soft gradient fills that fade into the floor.
Outlined Candlestick Chart
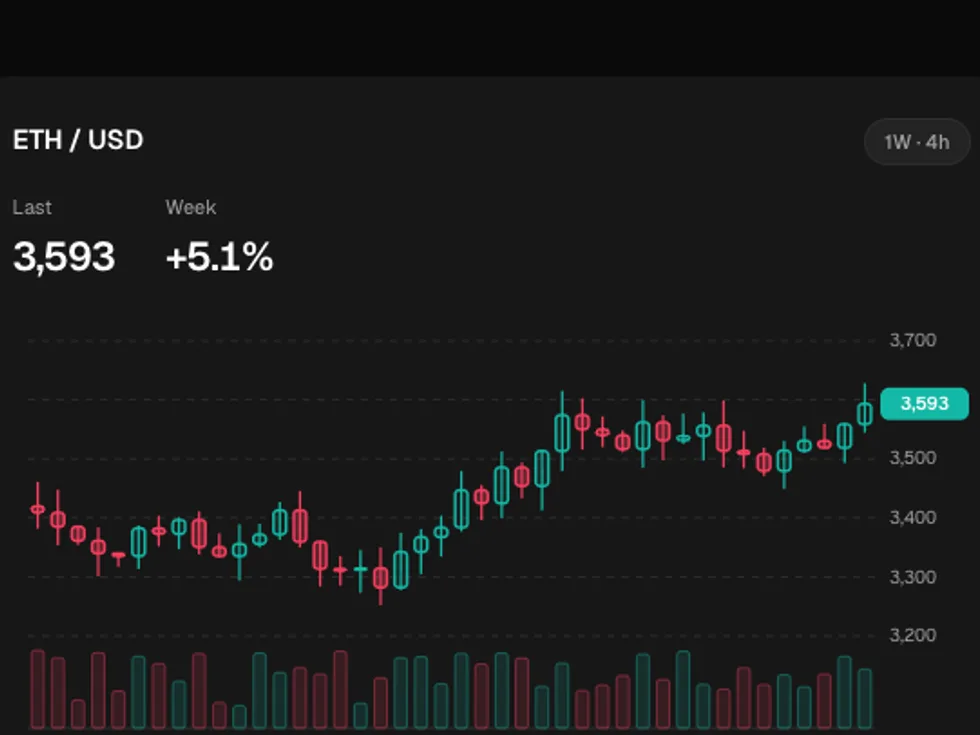
ChartOpen, high, low and close per period with volume underneath; candles open from their midpoint, and hovering draws a crosshair and tags the close — hairline outlines over a faint tint.

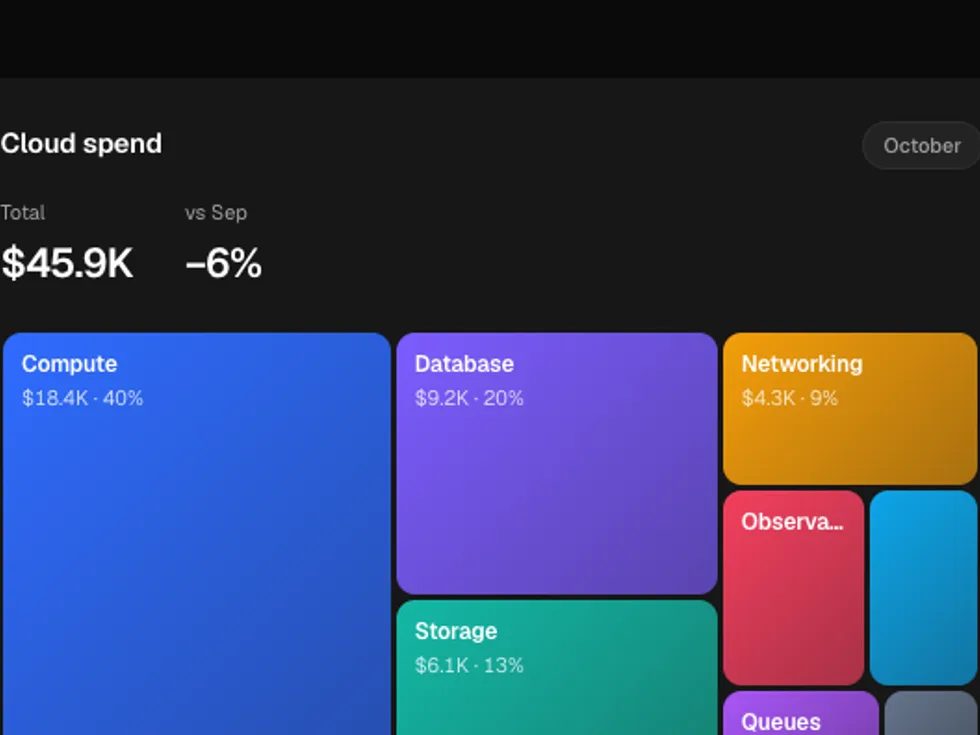
Gradient Treemap
ChartTiles sized by value and laid out squarified, settling in largest first with labels where they fit; hovering shows the value and share — soft gradient fills that fade into the floor.
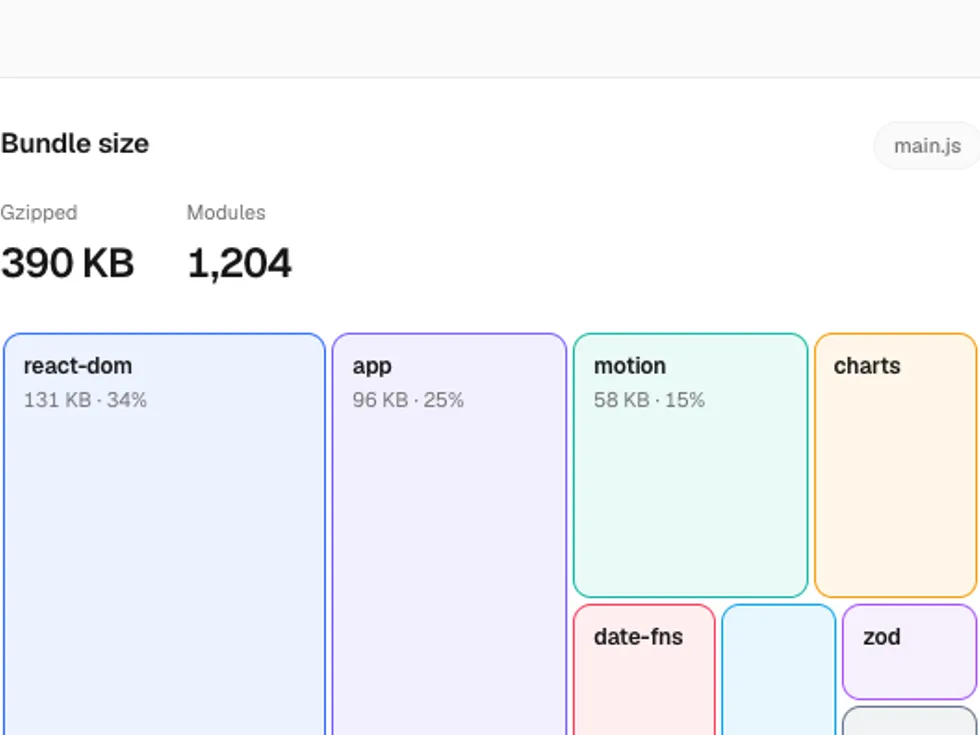
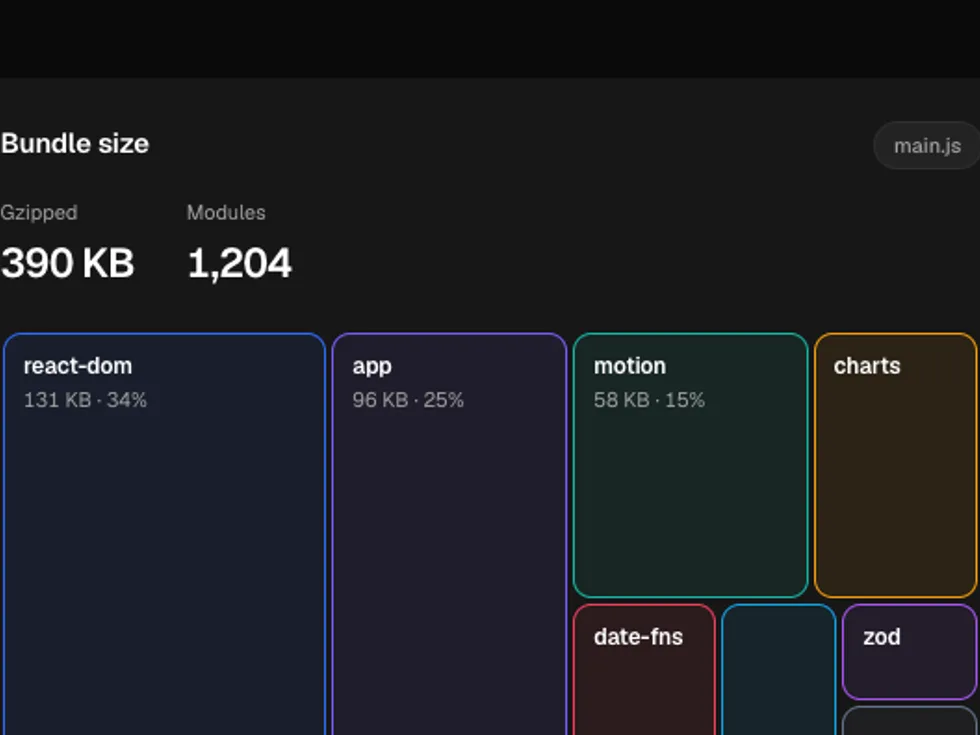
Outlined Treemap
ChartTiles sized by value and laid out squarified, settling in largest first with labels where they fit; hovering shows the value and share — hairline outlines over a faint tint.


Gradient Waffle Chart
ChartShares of a whole as a grid of squares, one per percent, filling column by column with a legend beside; hovering lifts one category — soft gradient fills that fade into the floor.


Outlined Waffle Chart
ChartShares of a whole as a grid of squares, one per percent, filling column by column with a legend beside; hovering lifts one category — hairline outlines over a faint tint.
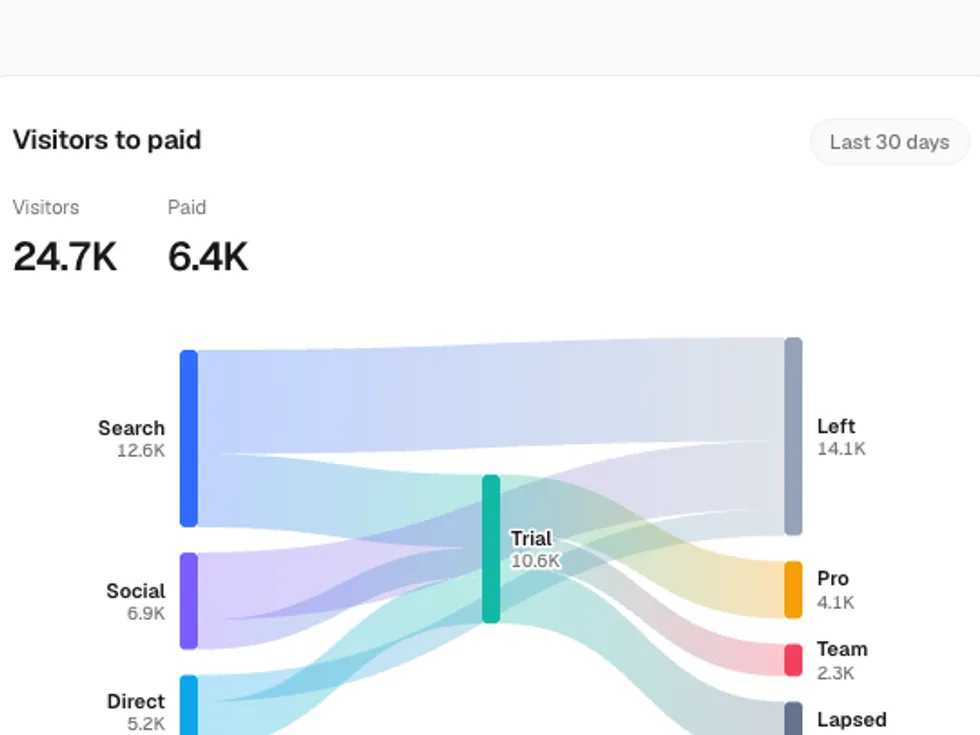
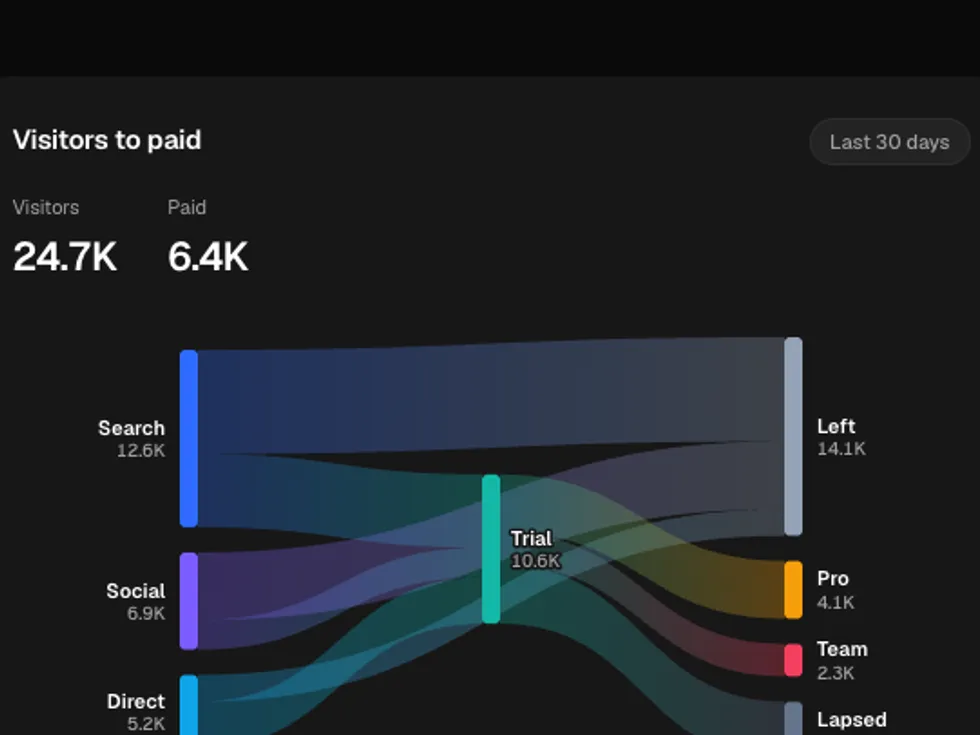
Gradient Sankey Chart
ChartNodes stacked in columns by what flows through them, with ribbons revealed left to right; hovering a ribbon or node picks out its flows — soft gradient fills that fade into the floor.
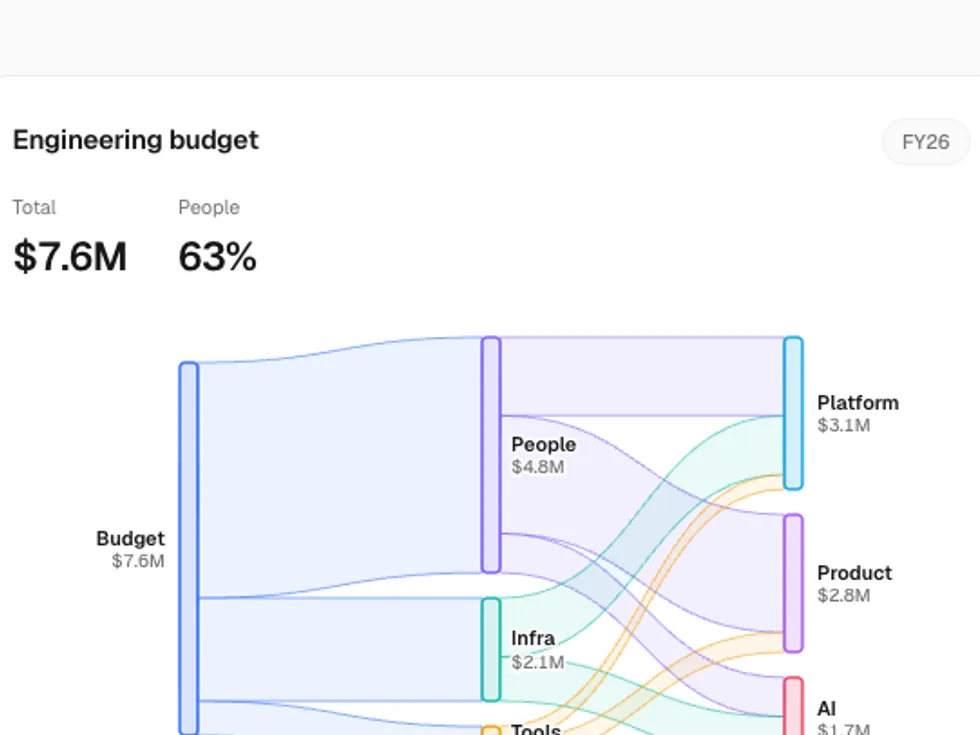
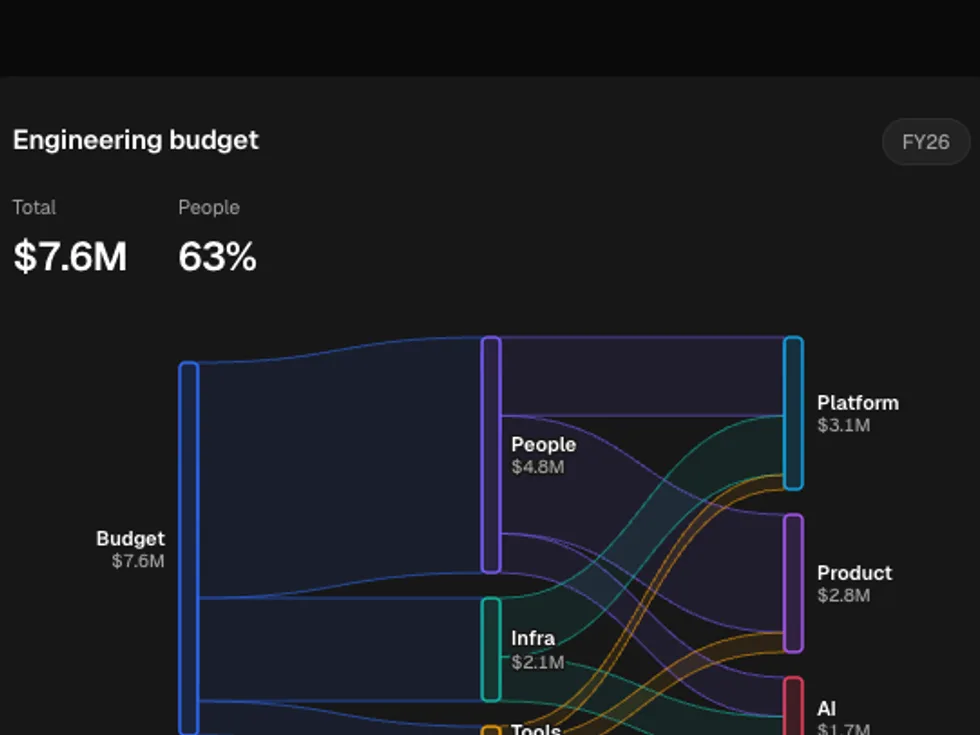
Outlined Sankey Chart
ChartNodes stacked in columns by what flows through them, with ribbons revealed left to right; hovering a ribbon or node picks out its flows — hairline outlines over a faint tint.