All components
Marketing sections, AI pieces, charts, interactives, backgrounds and text effects. Preview live, copy when you’re signed in.
53 results for “chart”
53 results for “chart”
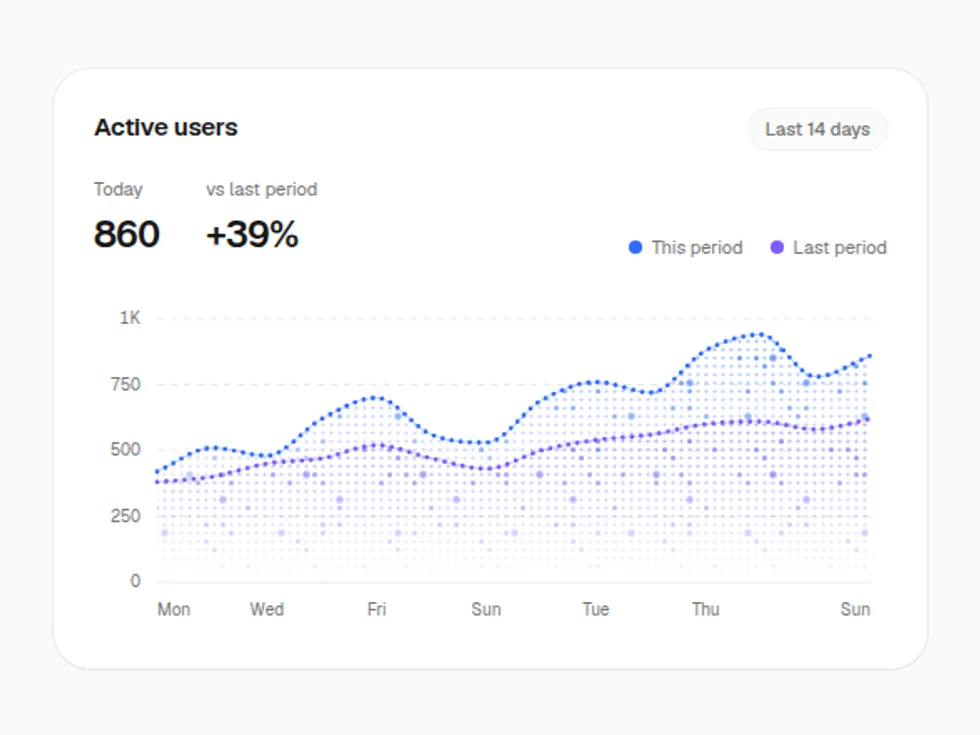
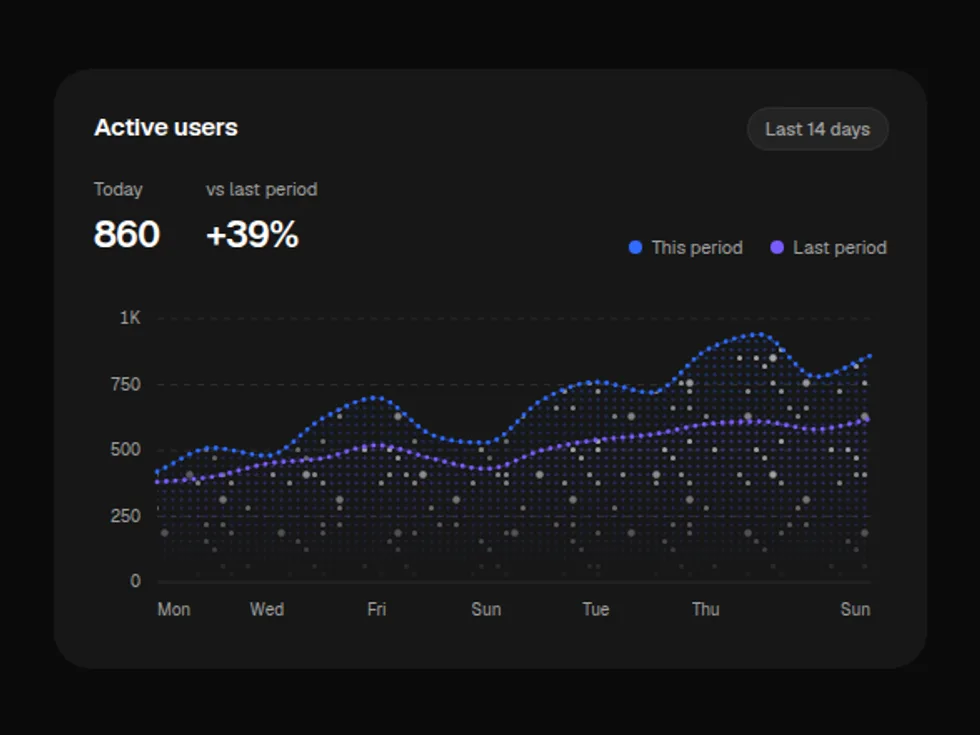
Sparkle Line Chart
ChartSmooth lines that draw in from the left, with a crosshair tooltip across every series — an electrified dot grid with twinkling four-point sparks.
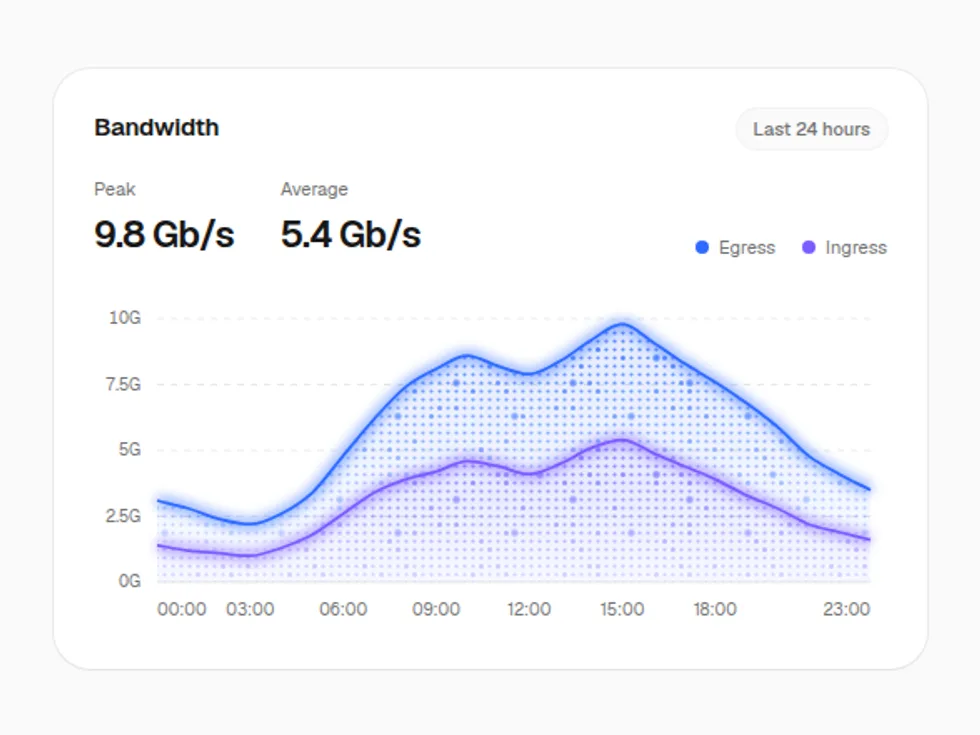
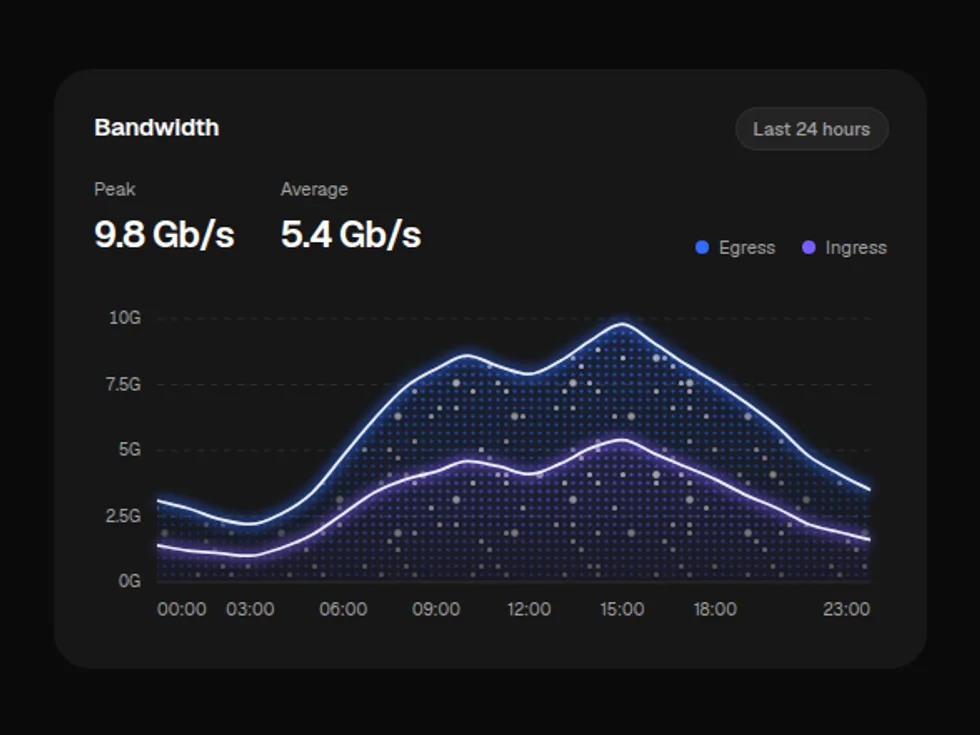
Sparkle Area Chart
ChartFilled trends that sweep in from the left, overlapping or stacked, with a crosshair tooltip — an electrified dot grid with twinkling four-point sparks.
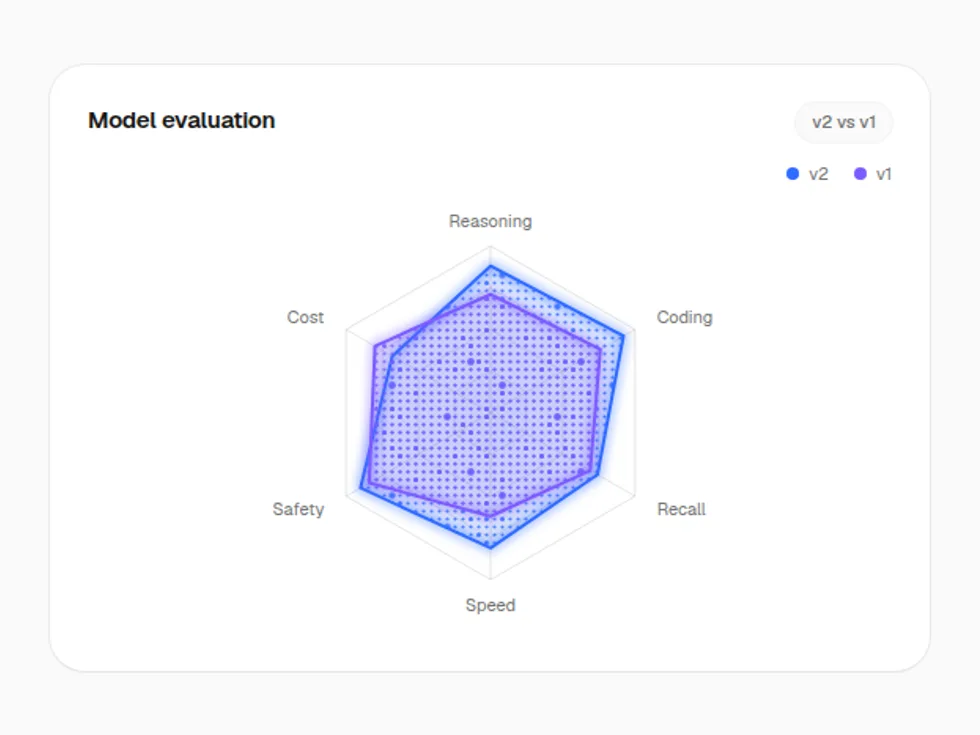
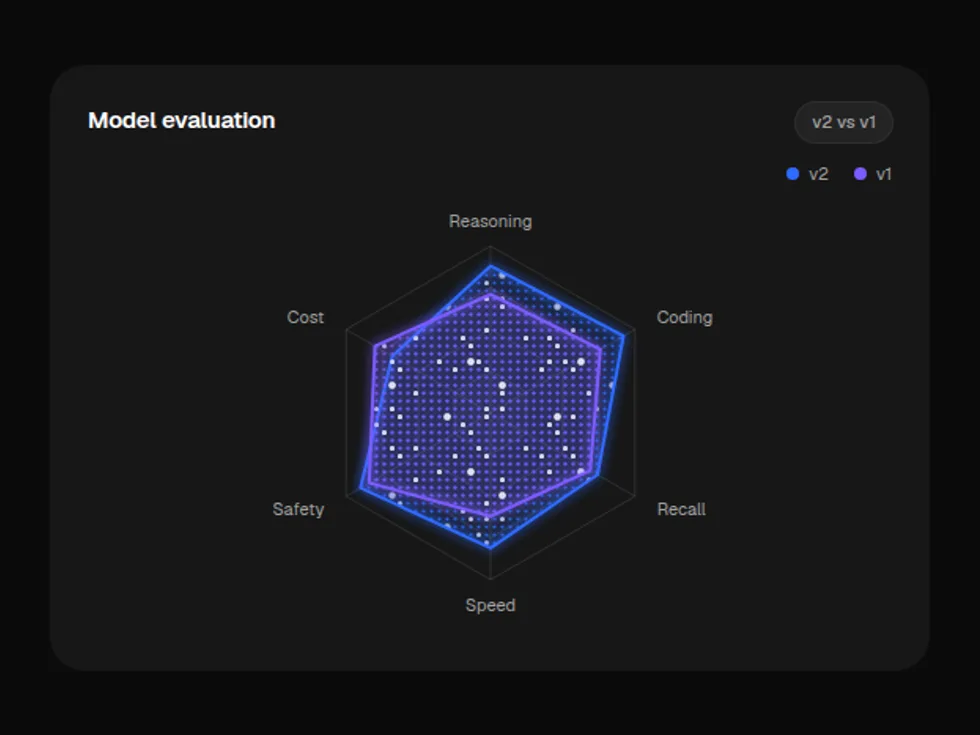
Sparkle Hexagon Chart
ChartA radar chart on a hexagonal grid; each series grows out of the centre — an electrified dot grid with twinkling four-point sparks.
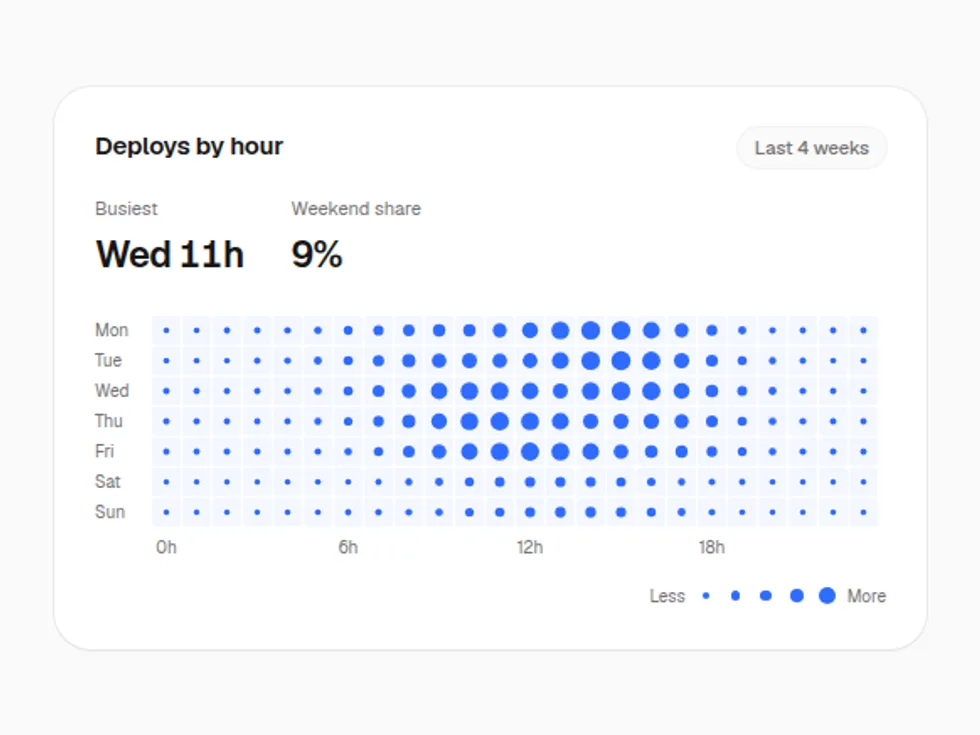
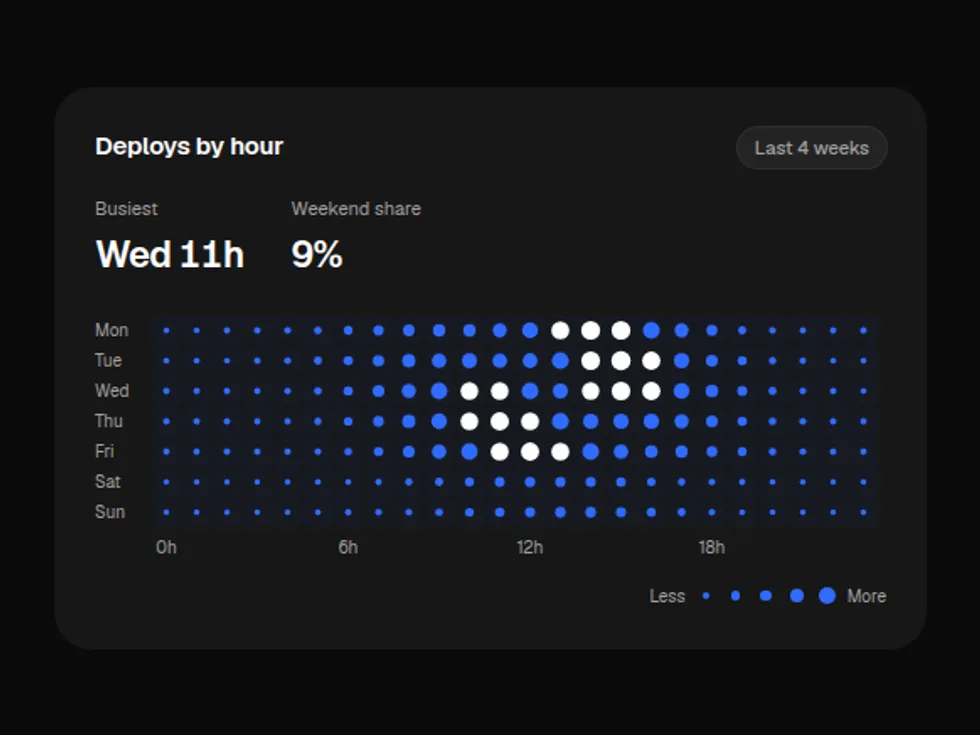
Sparkle Heatmap
ChartA grid shaded by value that cascades in diagonally, with a row-and-column crosshair on hover — an electrified dot grid with twinkling four-point sparks.
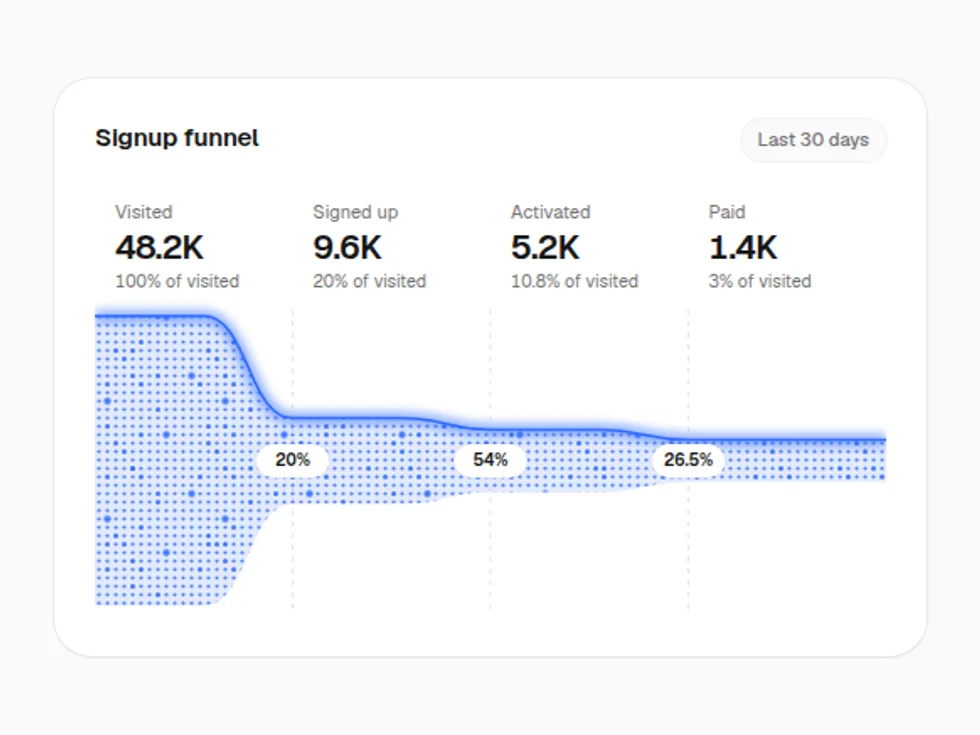
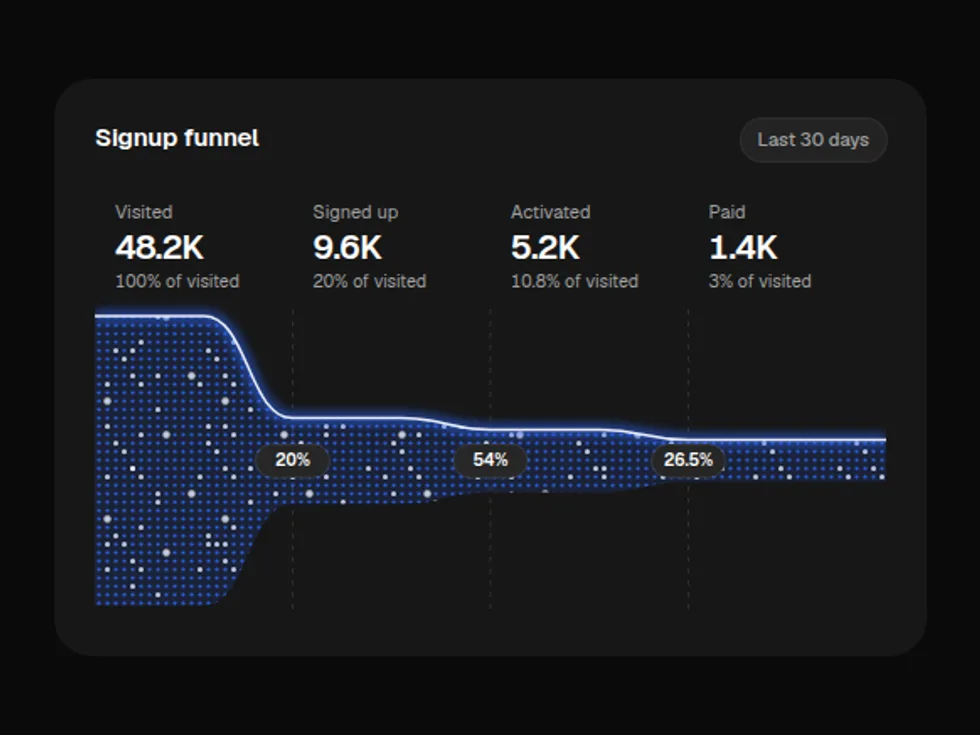
Sparkle Funnel Chart
ChartOne band that narrows stage by stage, with counts, shares and step-conversion pills — an electrified dot grid with twinkling four-point sparks.
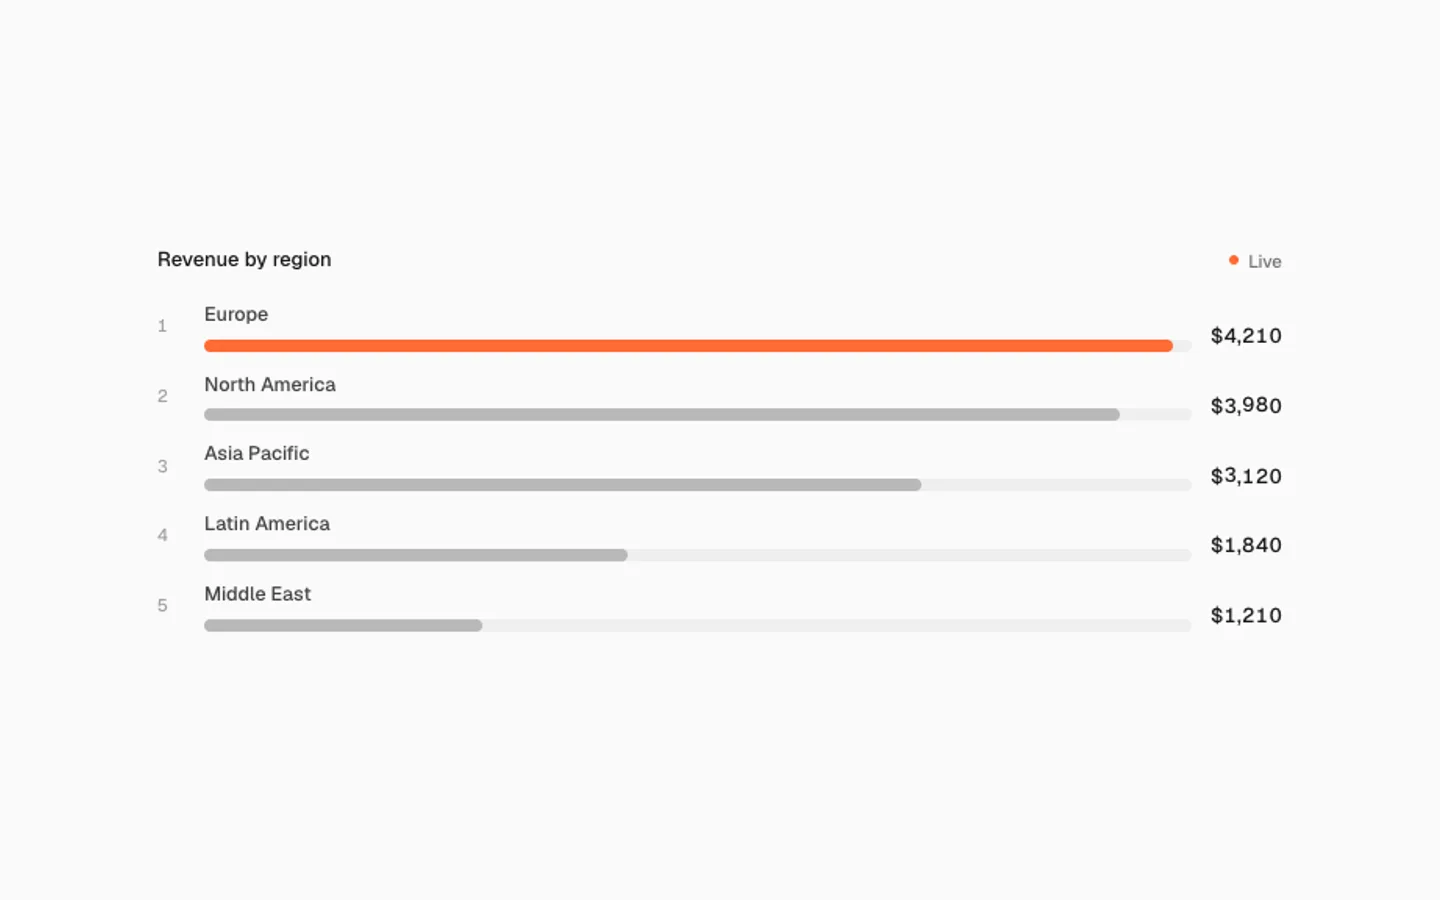
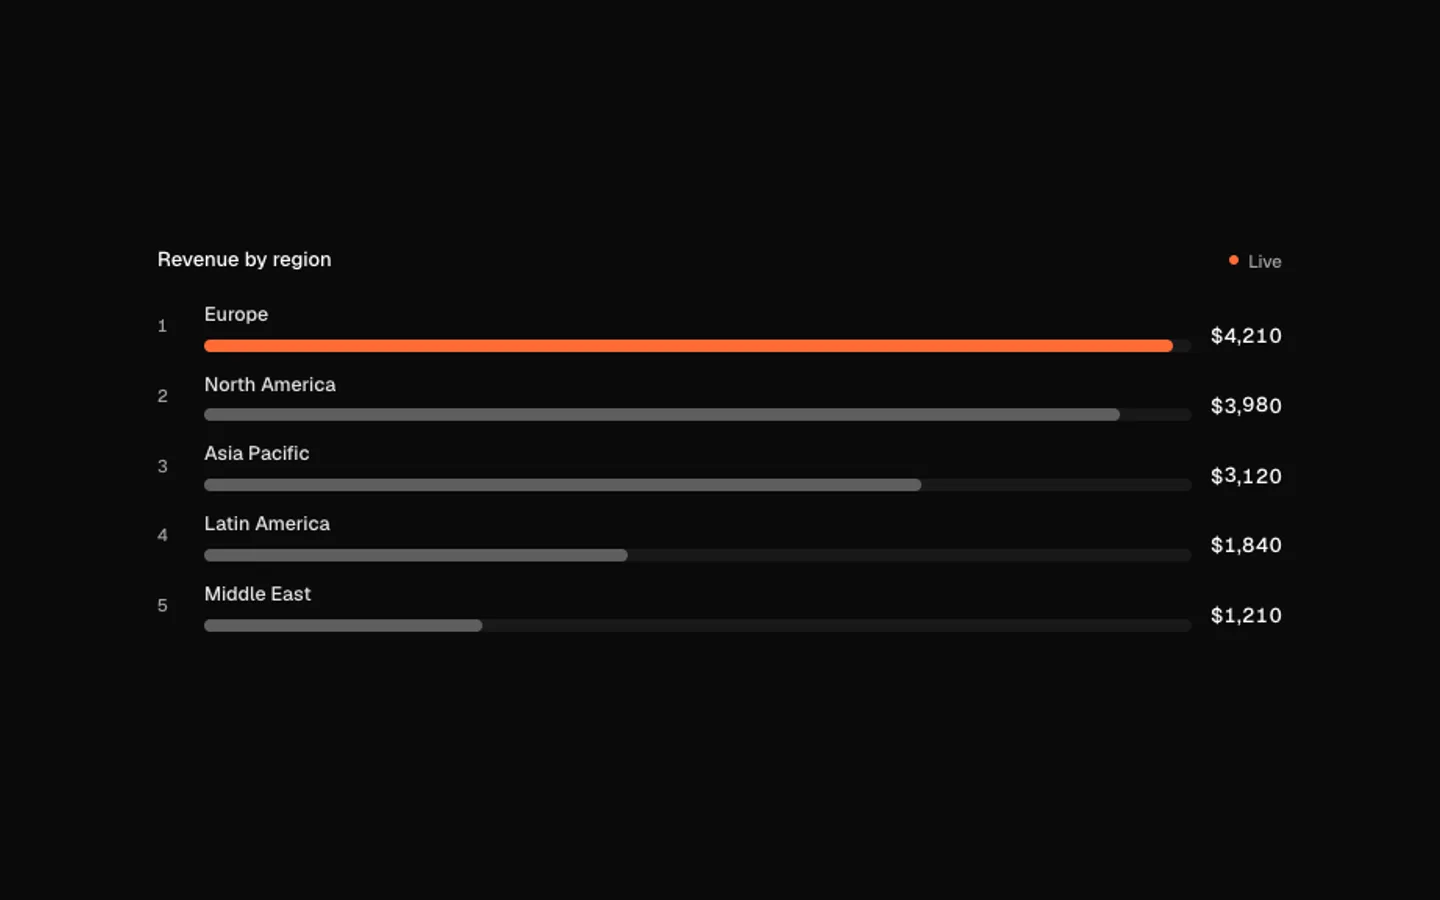
Bar Race
SectionA live leaderboard whose rows re-sort on a spring as values change. Numbers roll digit by digit, the leader takes the accent, and a row that climbs shows how many places it gained.
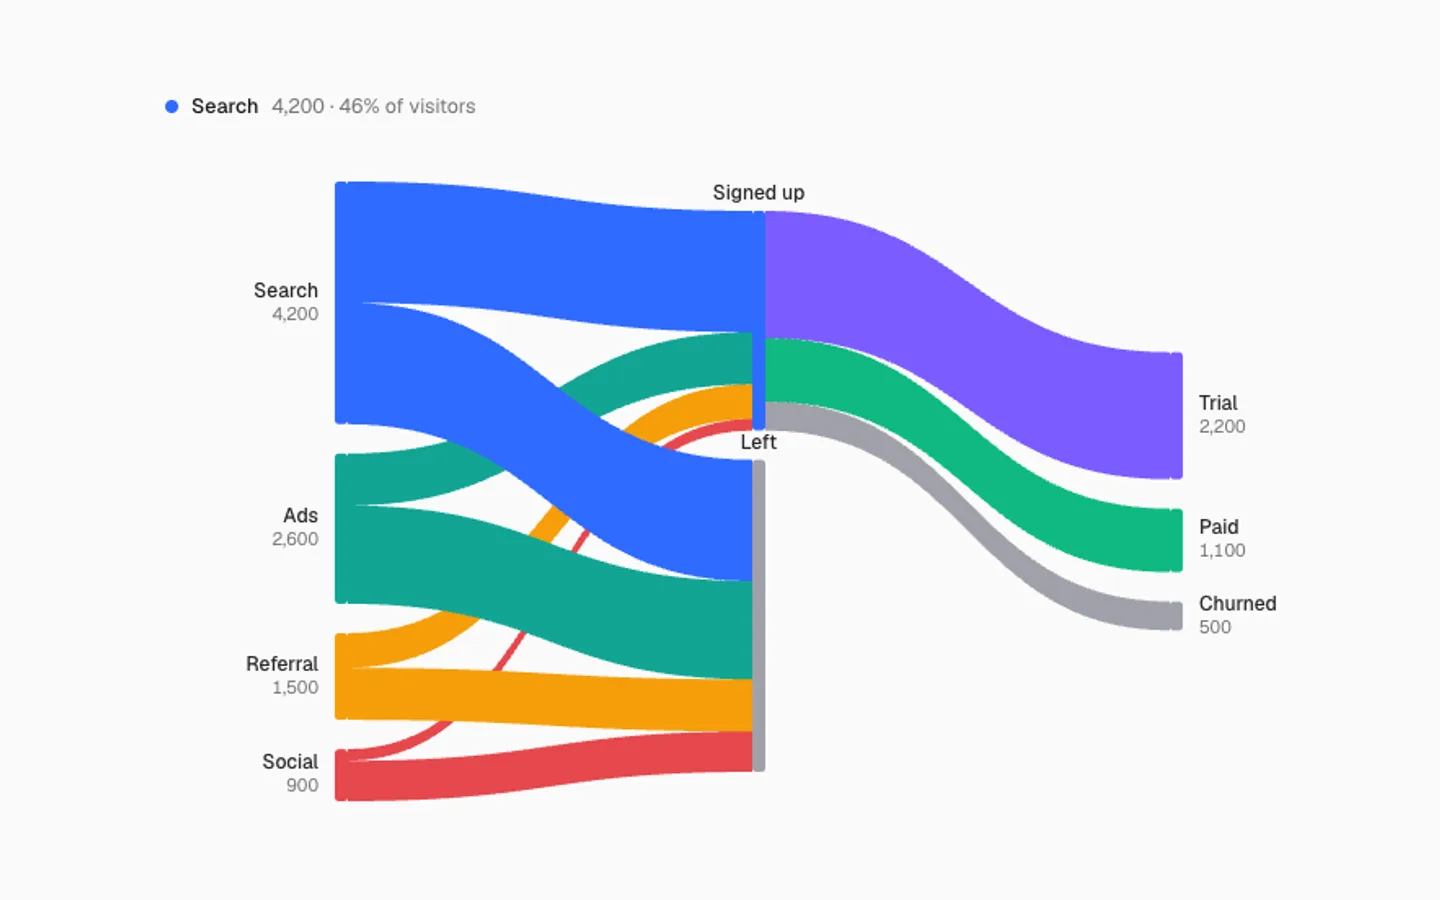
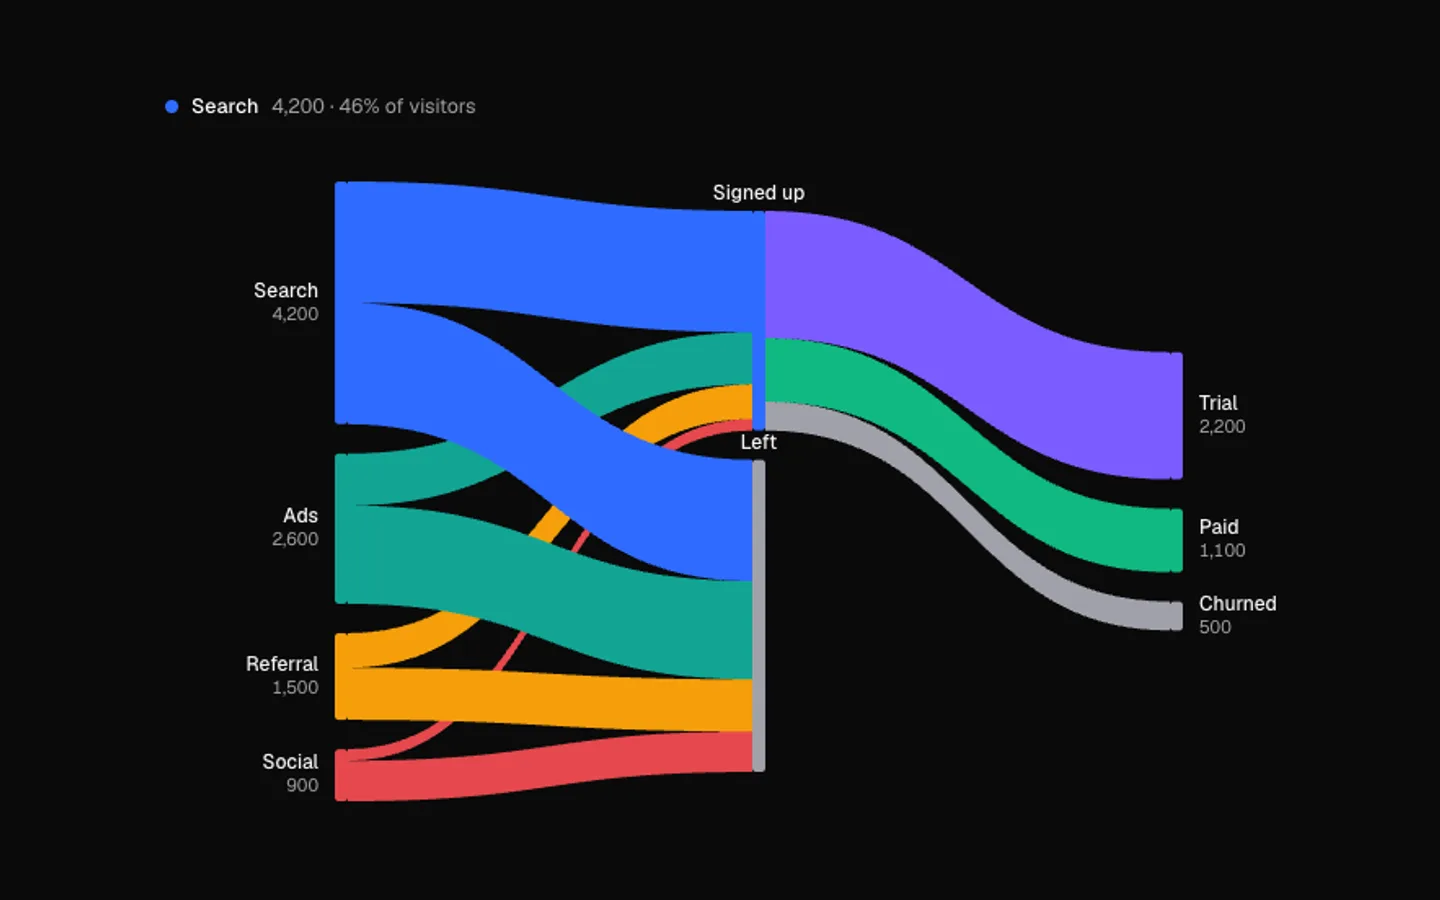
Sankey Flow
SectionWhere things go, as bands whose widths are the volume. Particles stream along every band, and the path through one node lights up while the rest steps back. It tours each source, or follows your pointer.
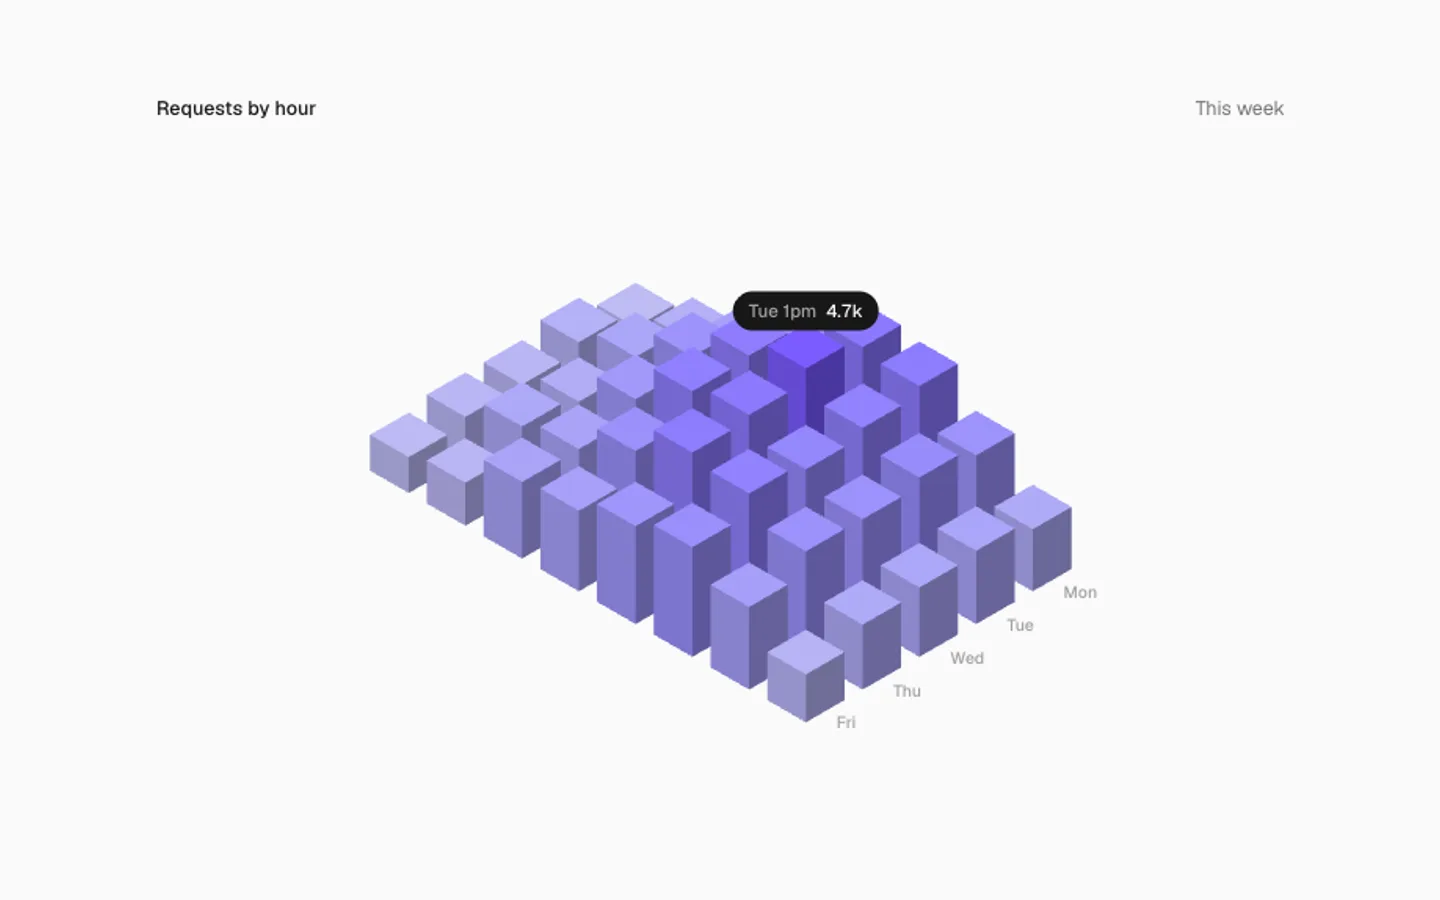
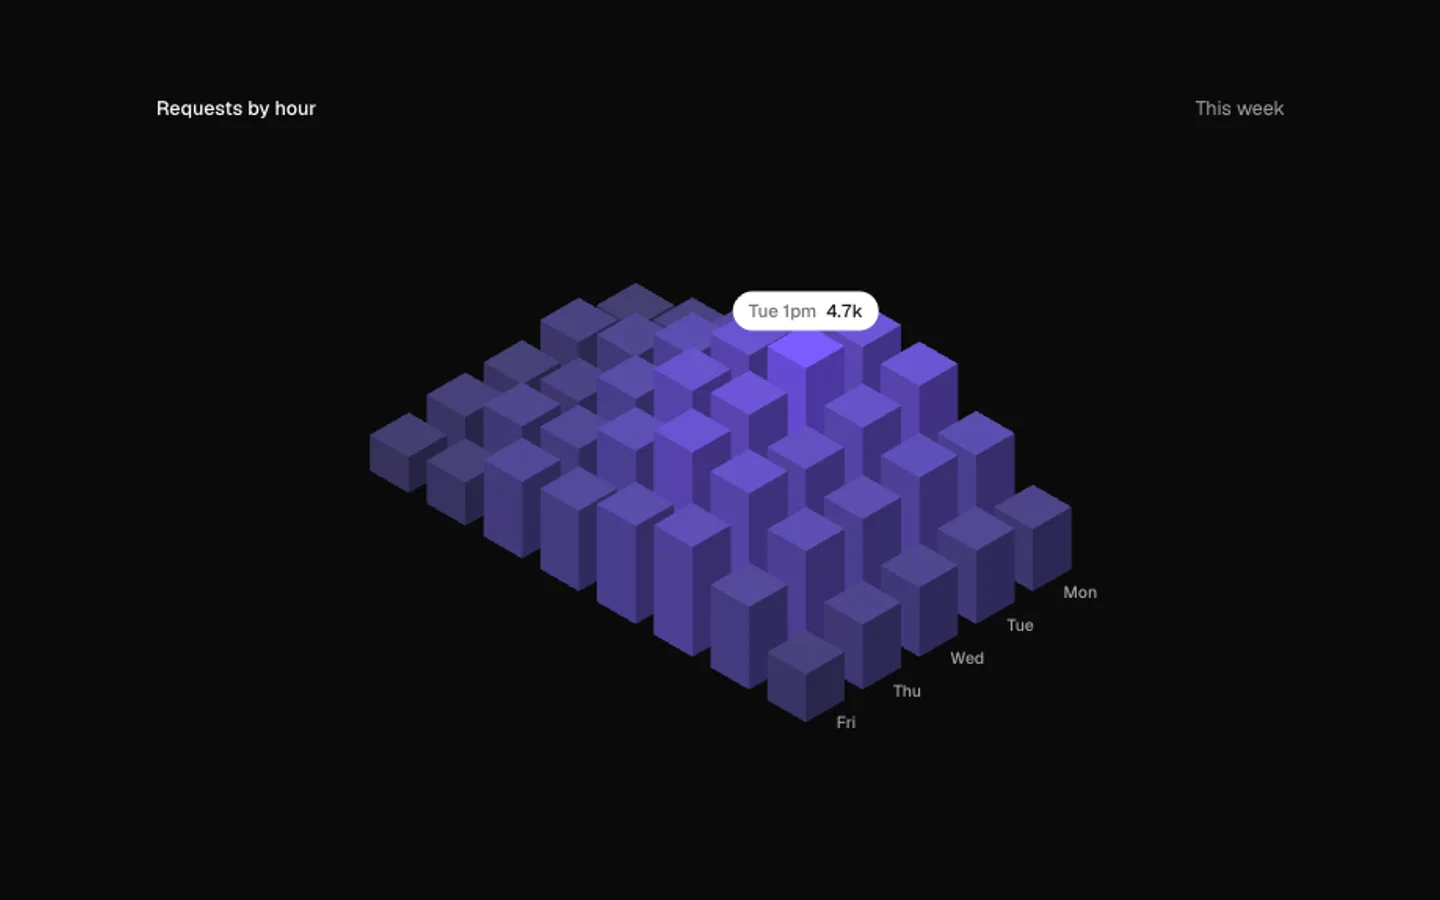
Bar City
SectionAn isometric city of bars, one block per value. Blocks spring up in a wave on view, then new data rolls in and every block springs to its new height. Point at a block to read it.
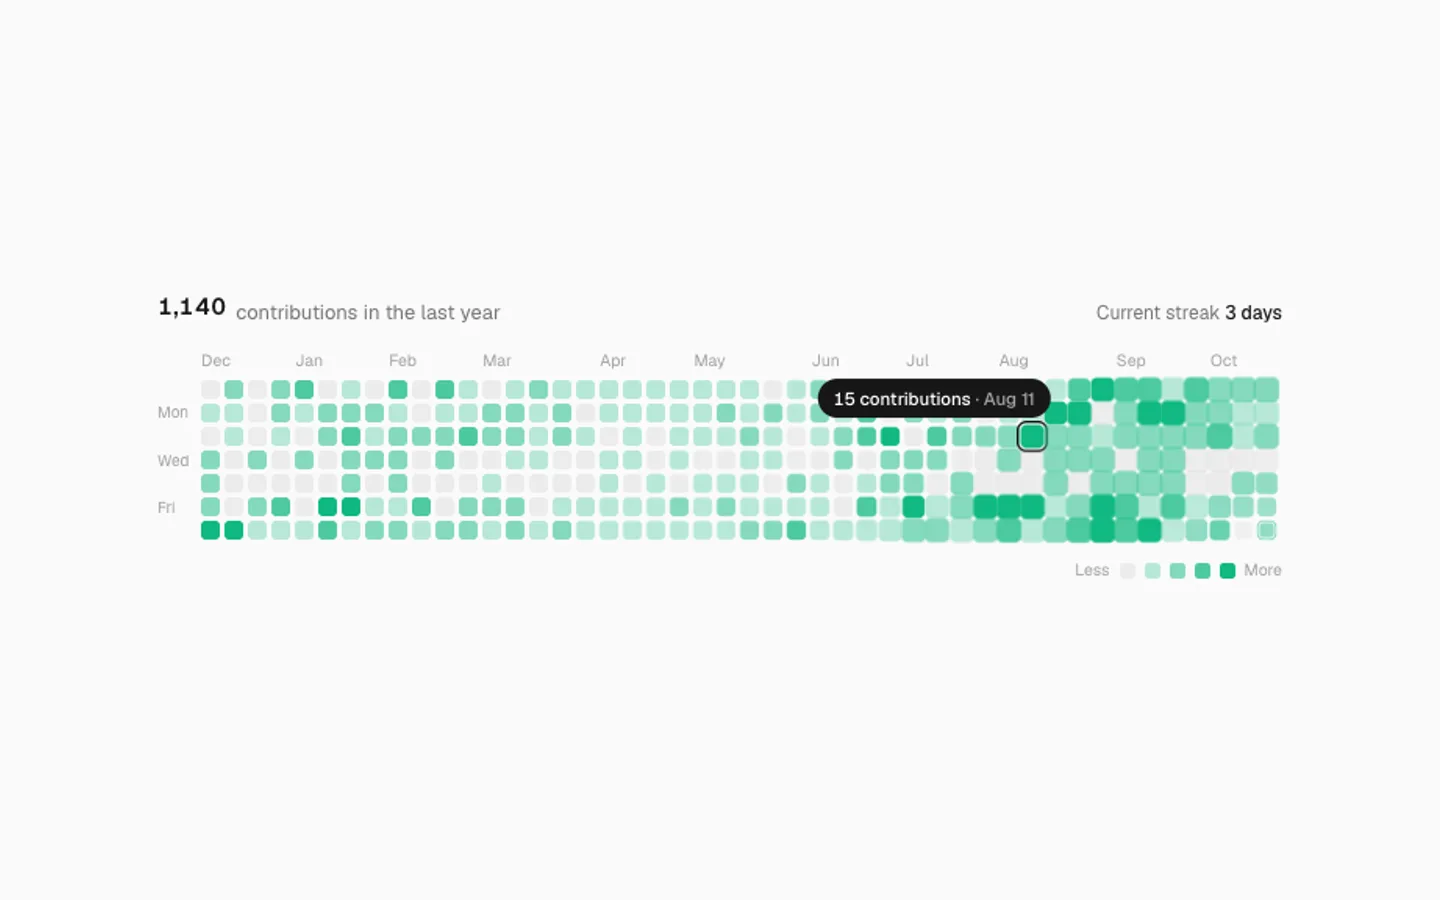
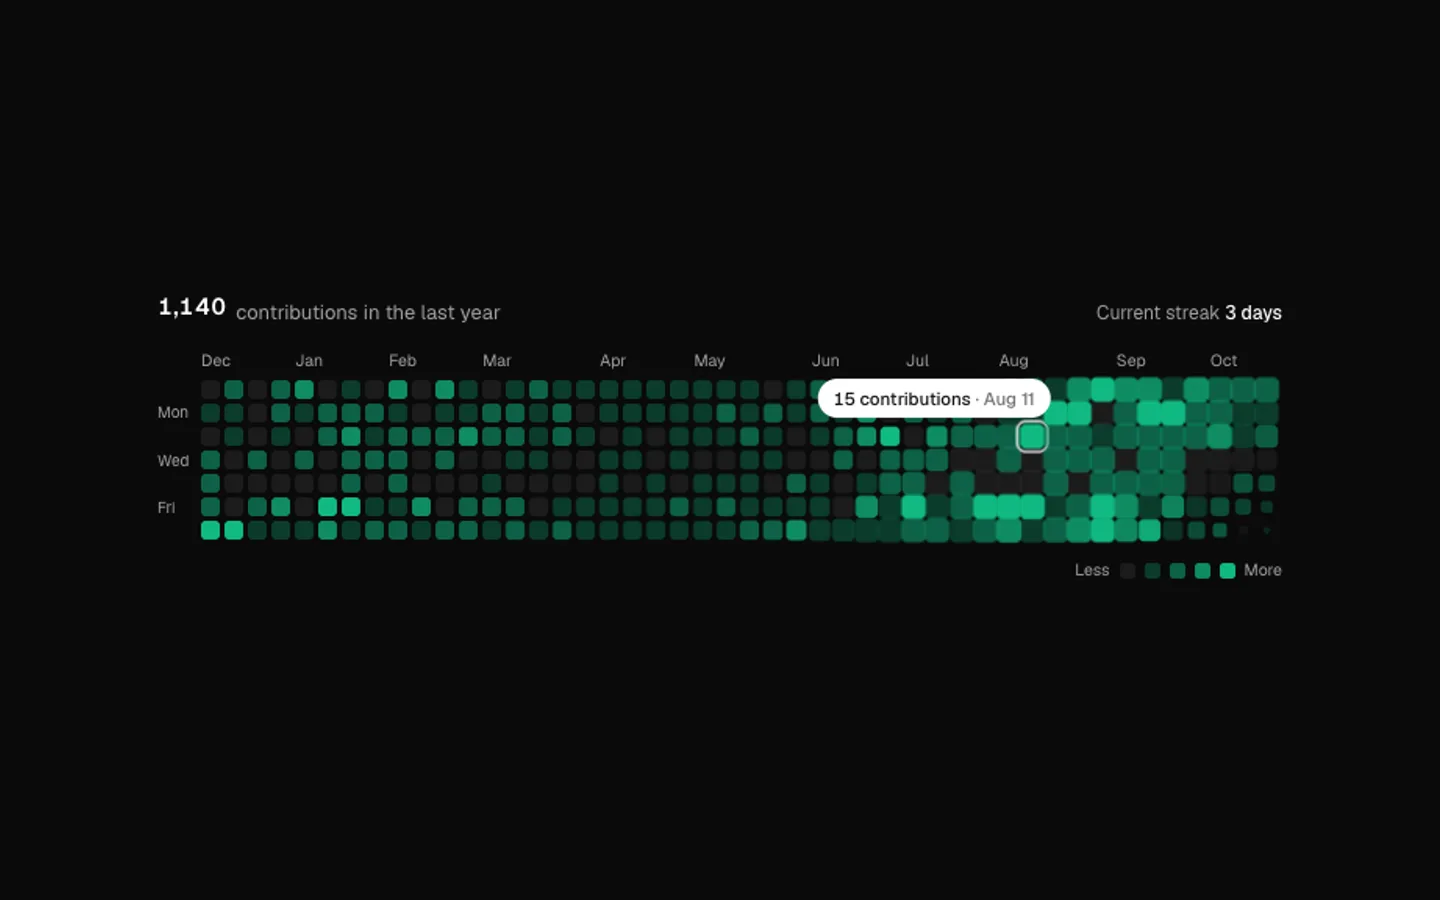
Contribution Heatmap
SectionA year of activity as a grid of days. Weeks pop in from left to right on view, today keeps ticking up and the total rolls. Point at any day to read it; left alone it visits the busiest days.
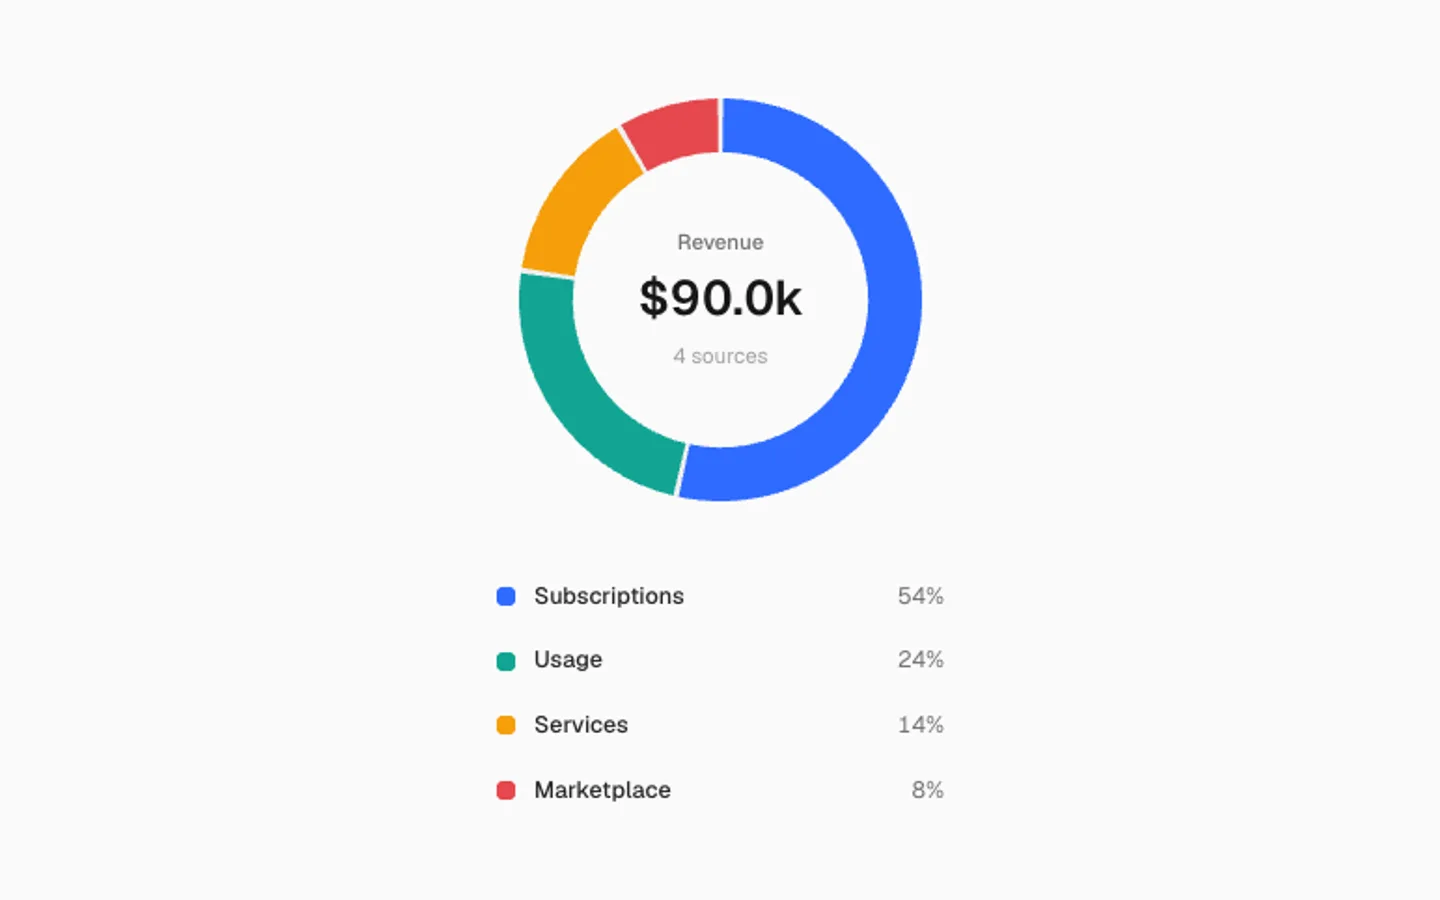
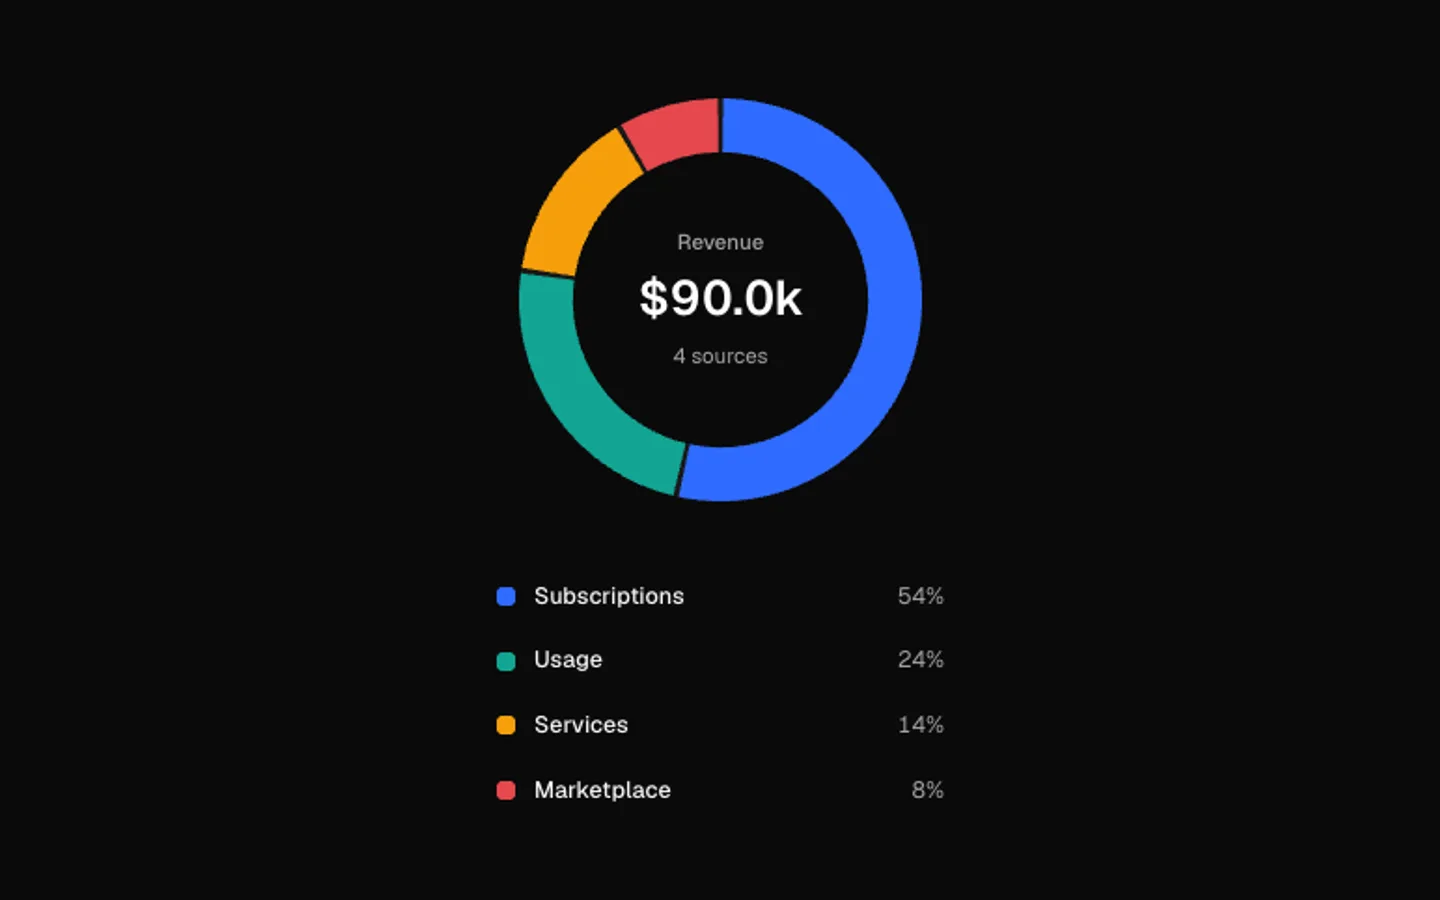
Donut Breakdown
SectionA donut that draws itself slice by slice on view. The picked slice slides out of the ring and the centre rolls to its value and share. It walks the slices on its own until you point at one.
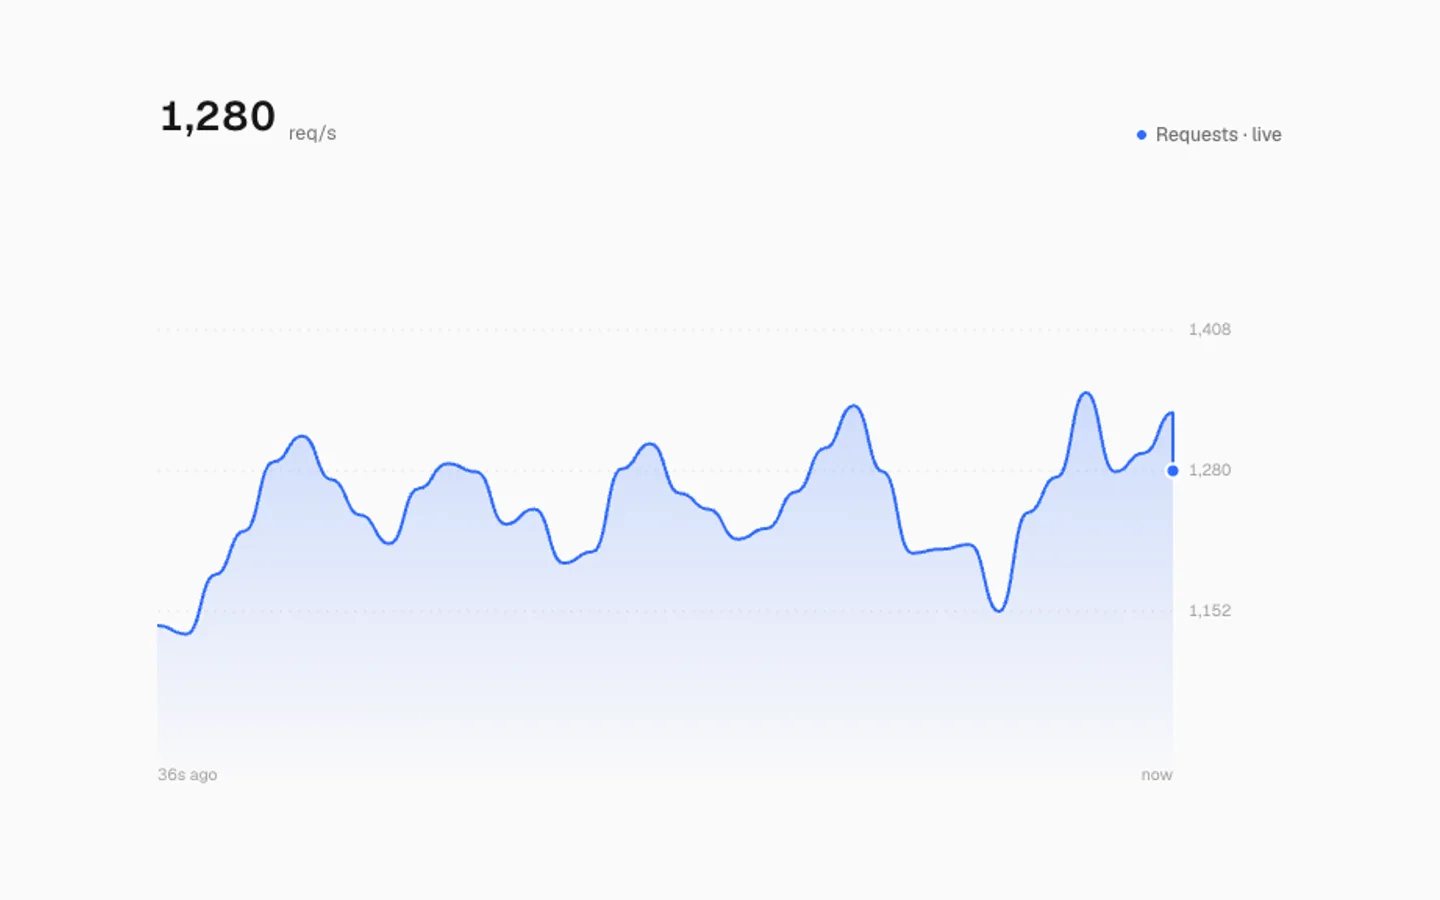
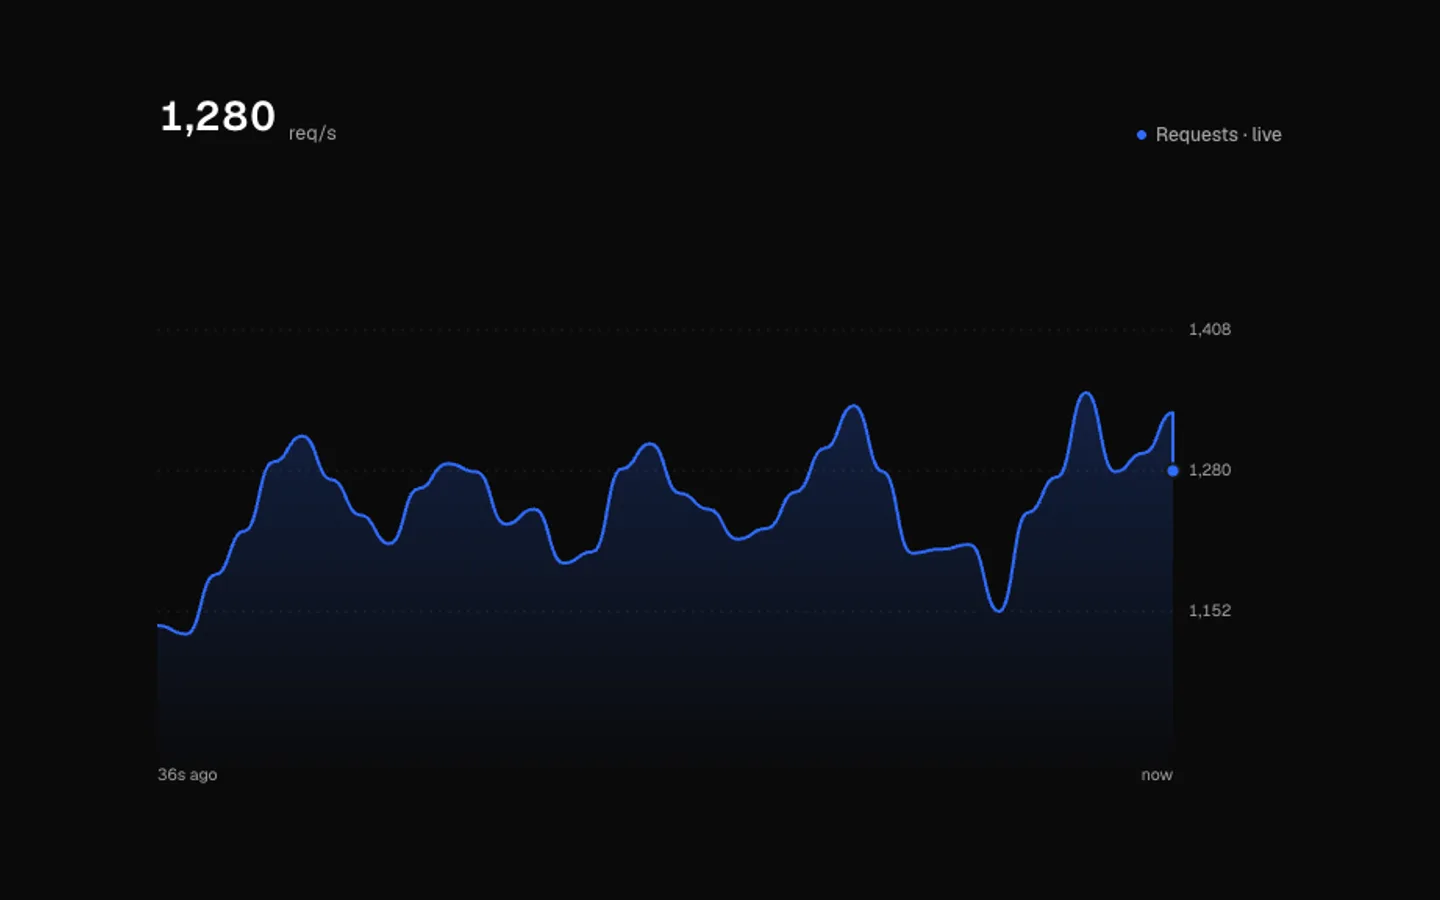
Live Line
SectionA live metric whose line scrolls left as new points arrive. A now dot rides the newest value, the reading rolls digit by digit, the scale eases to fit, and pointing at the line reads earlier points.
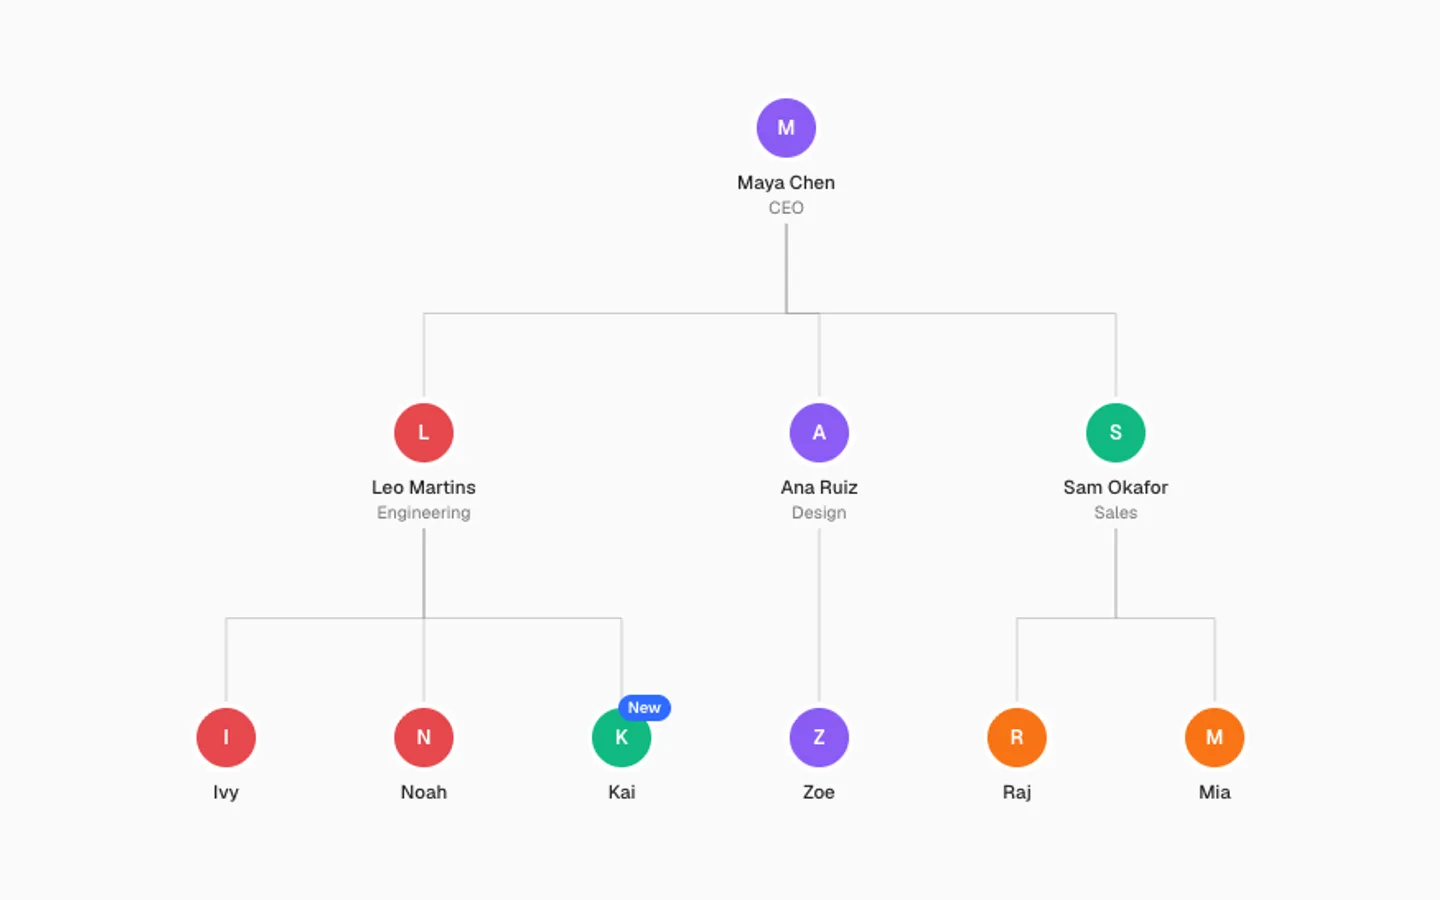
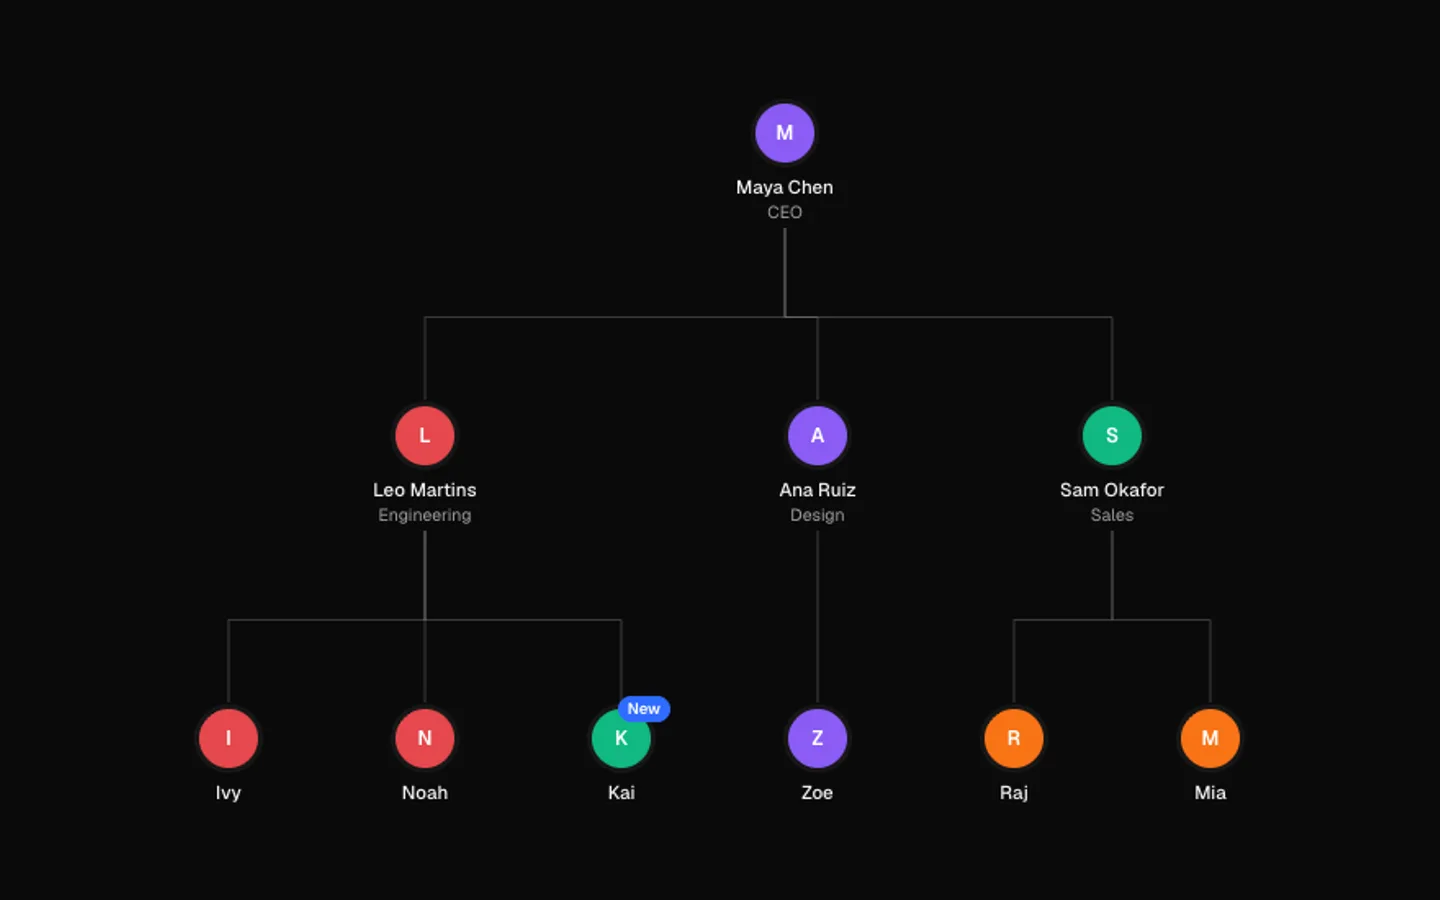
Org Tree
SectionA team that grows in front of you: the tree opens a level at a time as its lines draw in, then a new hire joins and teammates shuffle over. Point at anyone to trace them to the top.
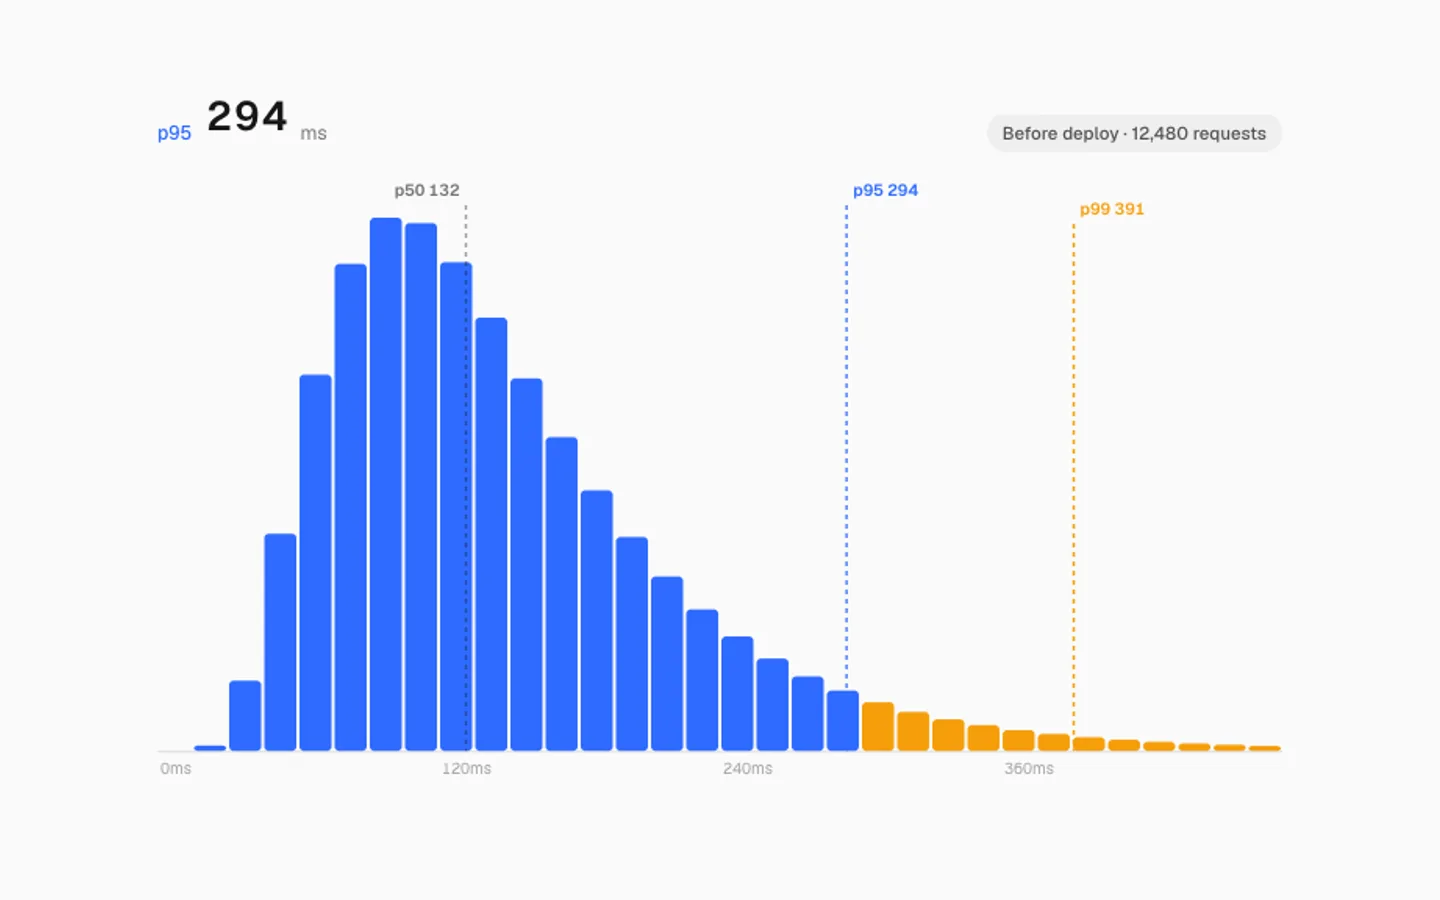
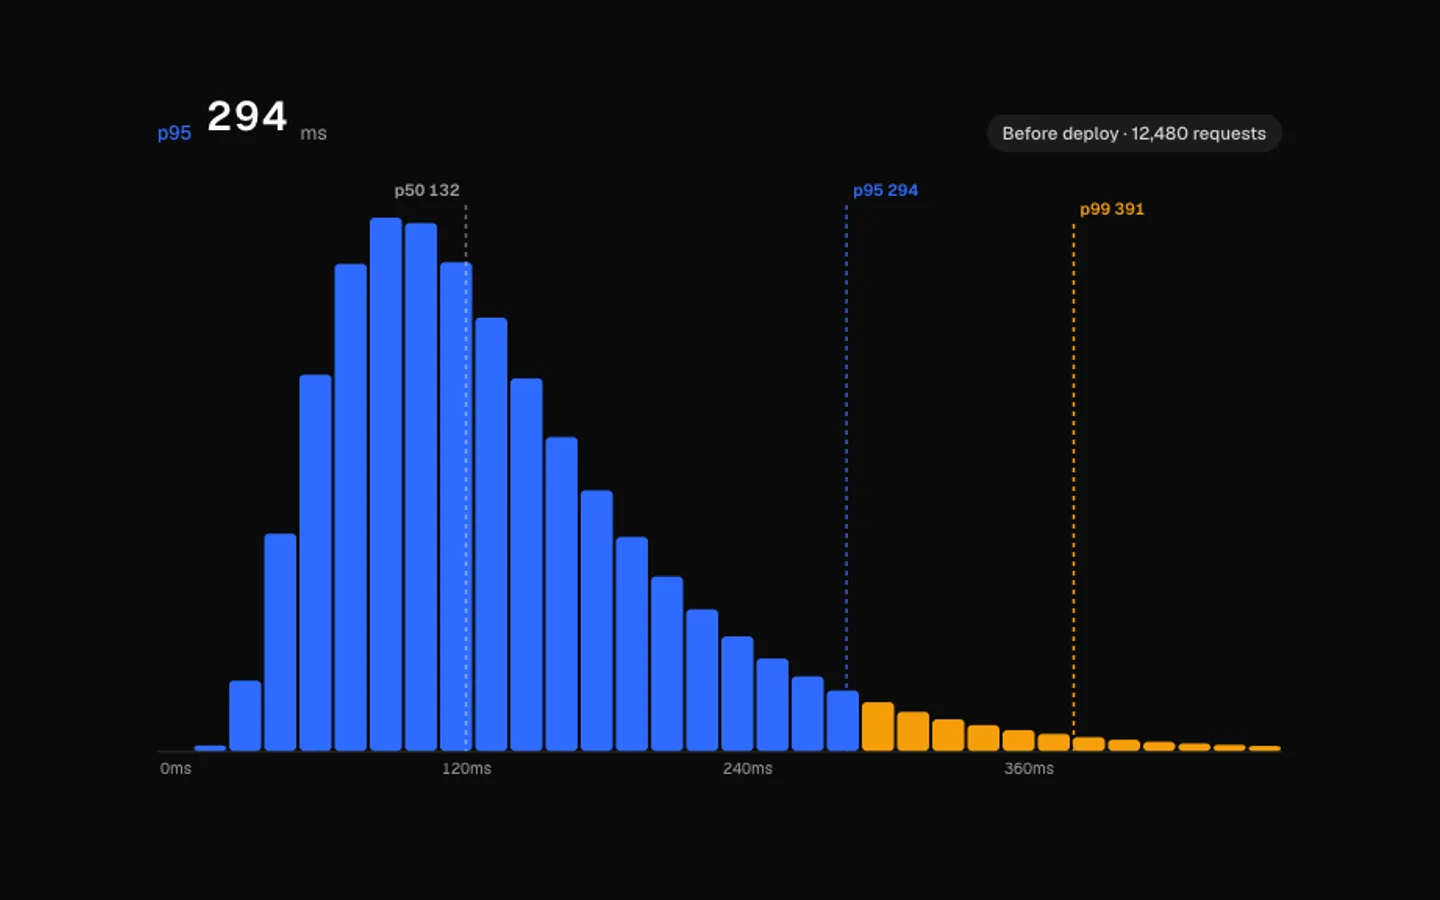
Latency Histogram
SectionHow long requests take, as a histogram. Bars spring to each new shape as conditions change, p50, p95 and p99 markers slide into place, and the slow tail turns amber. Point at a bar to read it.
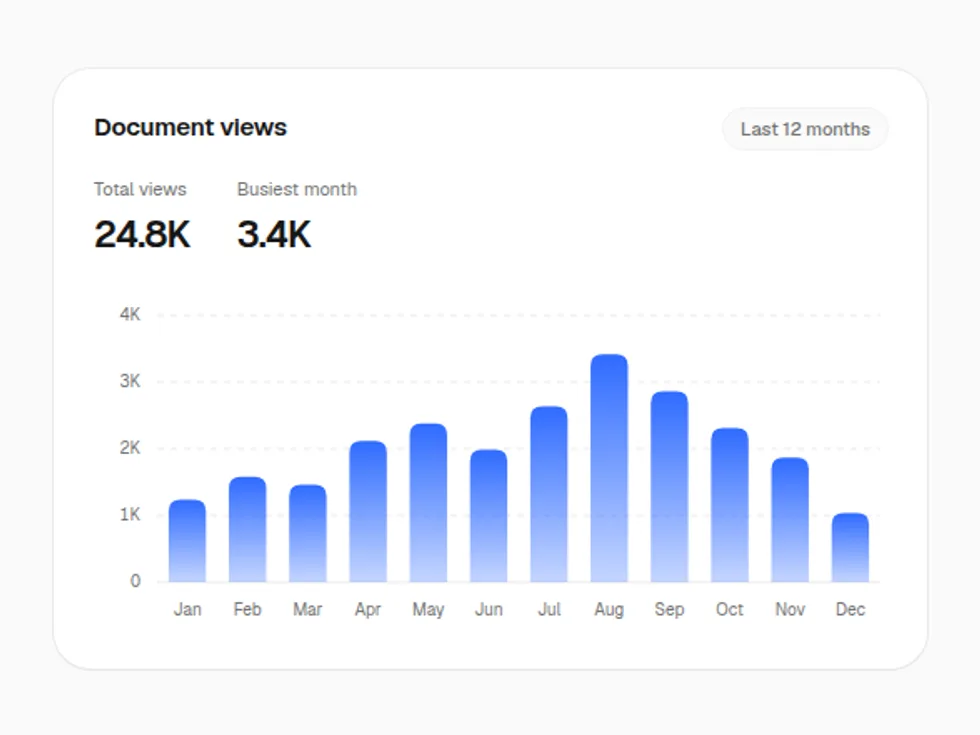
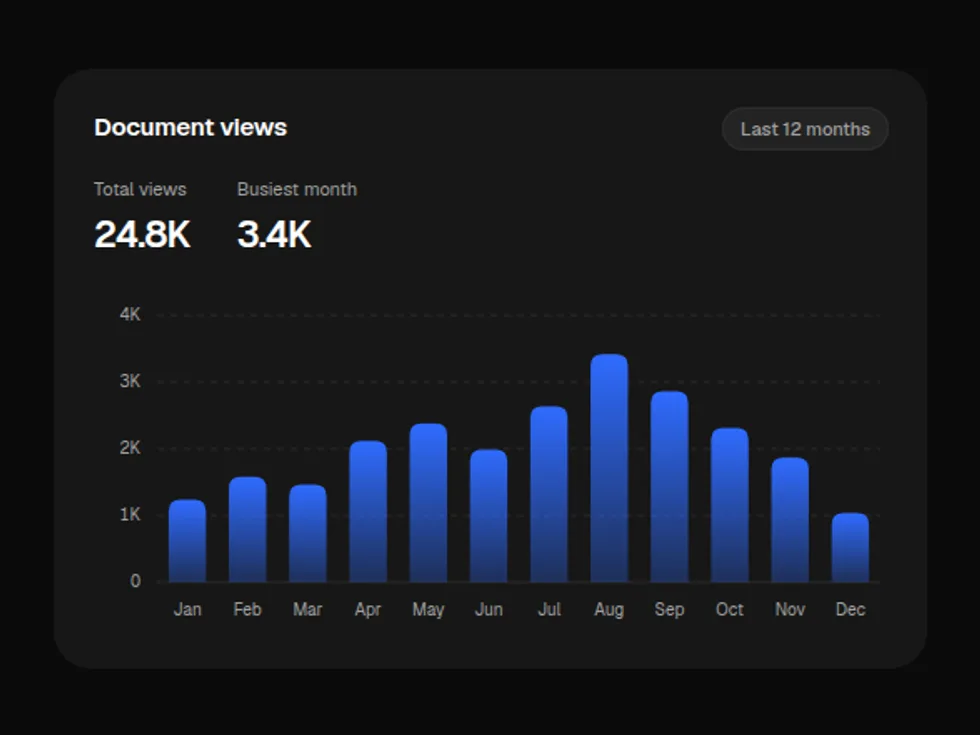
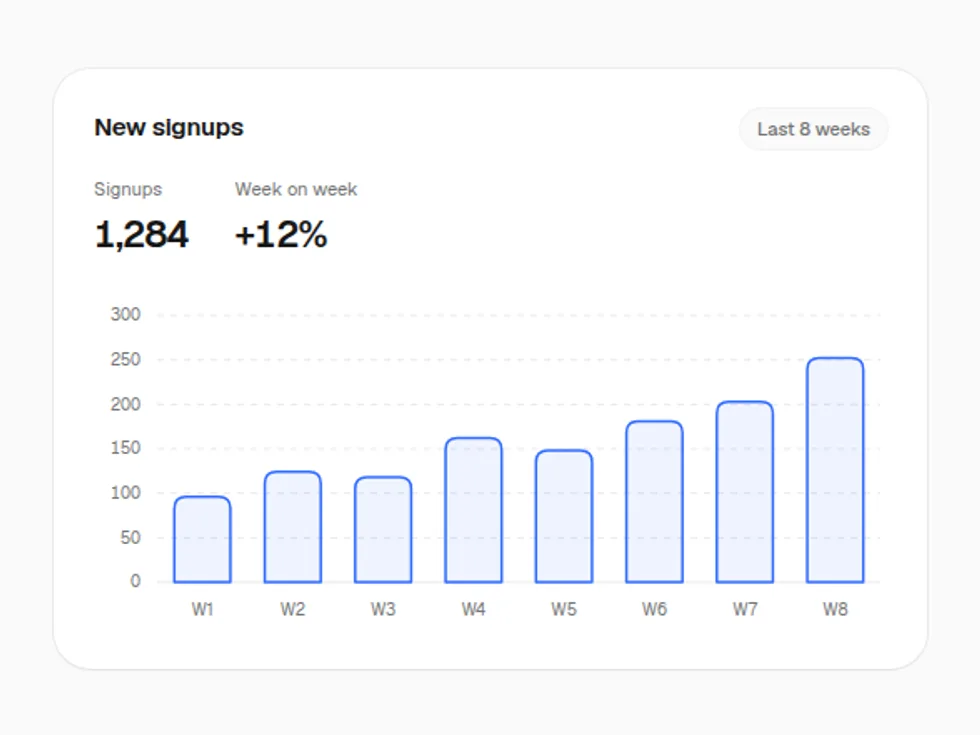
Gradient Bar Chart
ChartColumns that spring up on a dashed grid, with a pointer-following tooltip — soft gradient fills that fade into the floor.
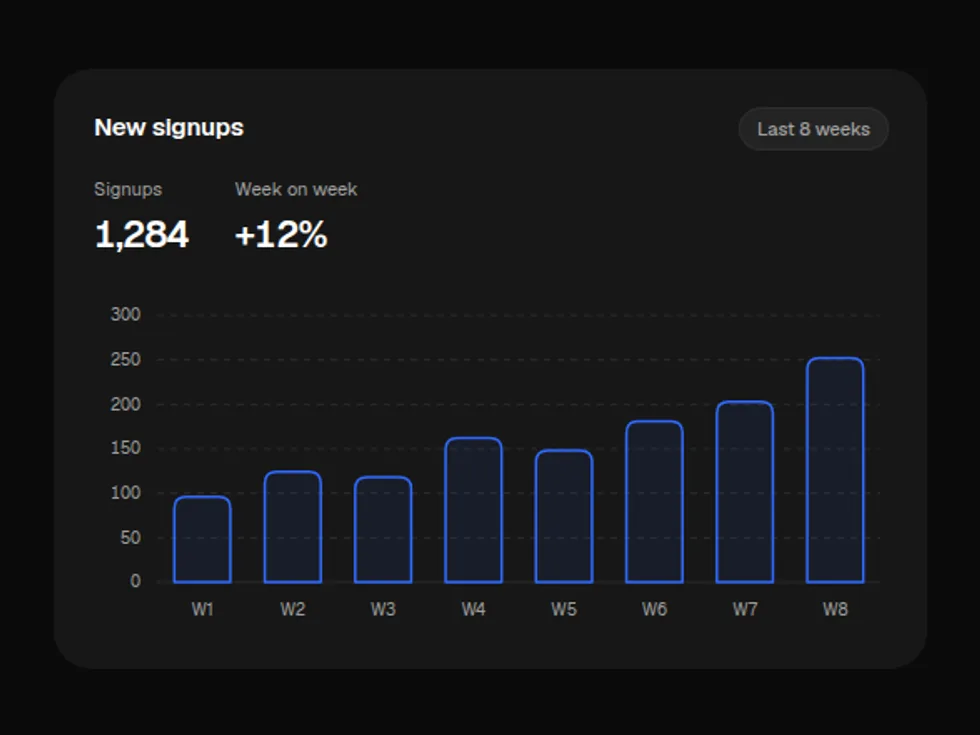
Outlined Bar Chart
ChartColumns that spring up on a dashed grid, with a pointer-following tooltip — hairline outlines over a faint tint.
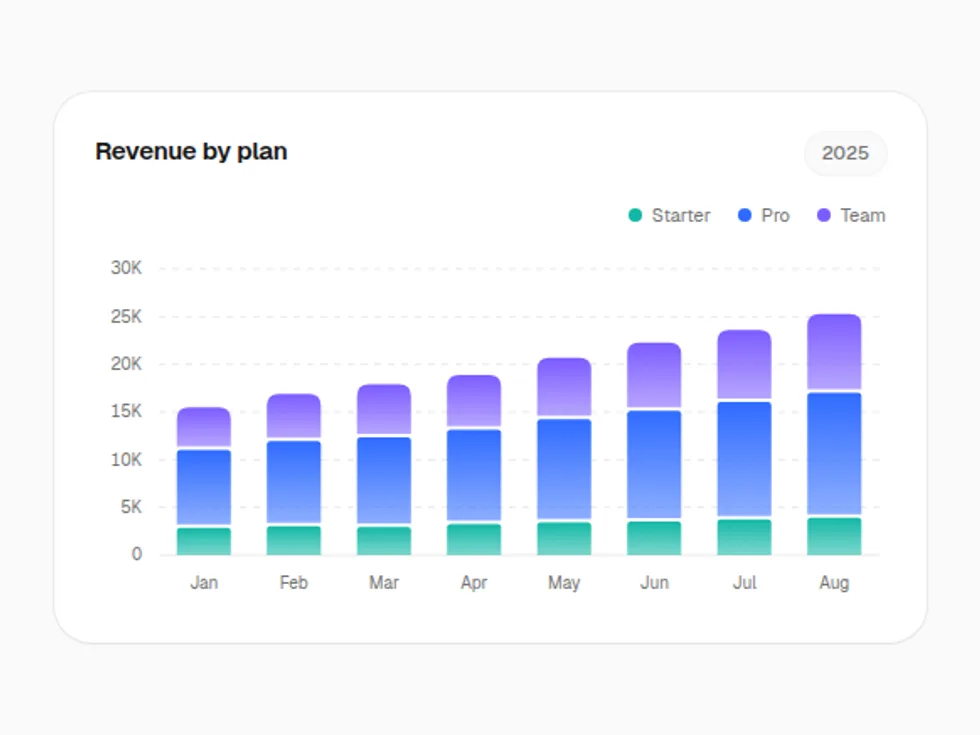
Gradient Stacked Bar Chart
ChartColumns of stacked segments that rise together, with every series and the total in the tooltip — soft gradient fills that fade into the floor.
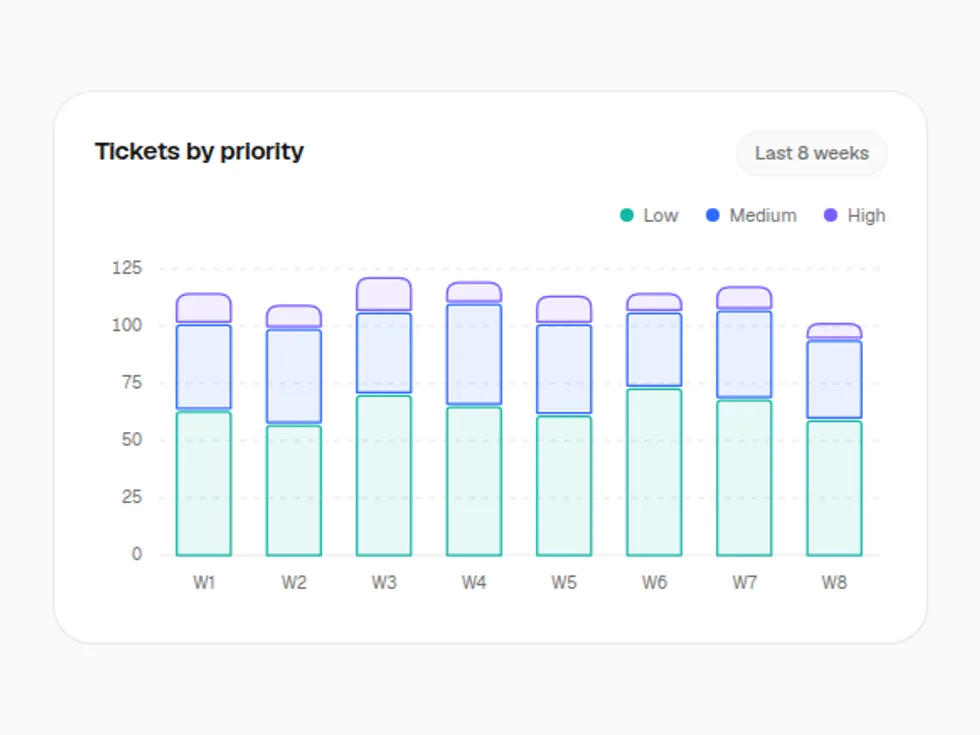
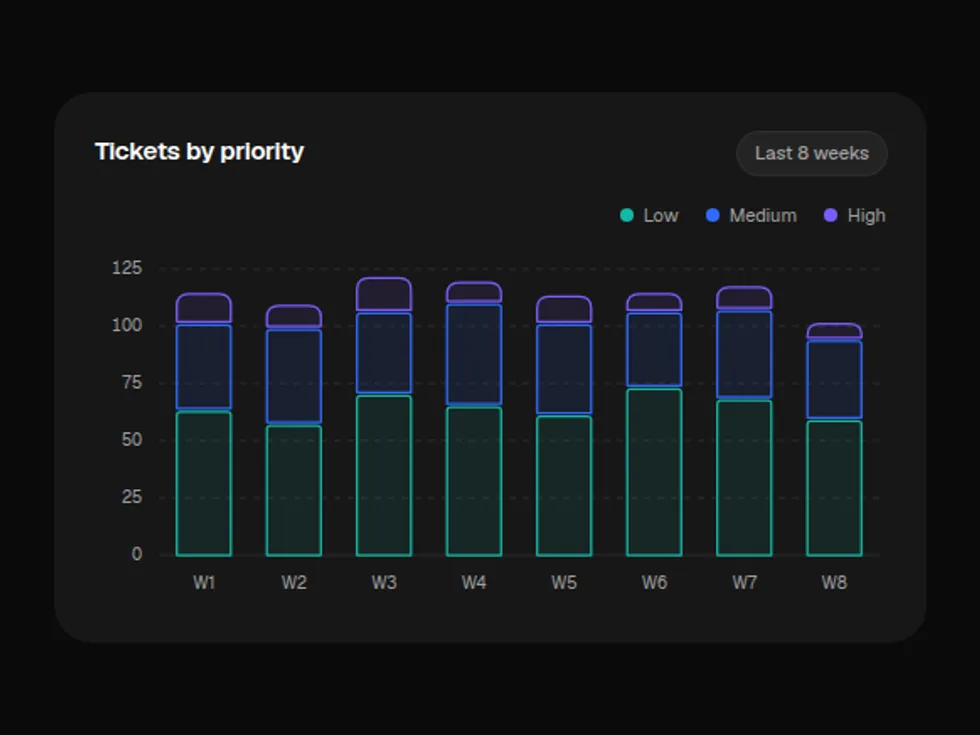
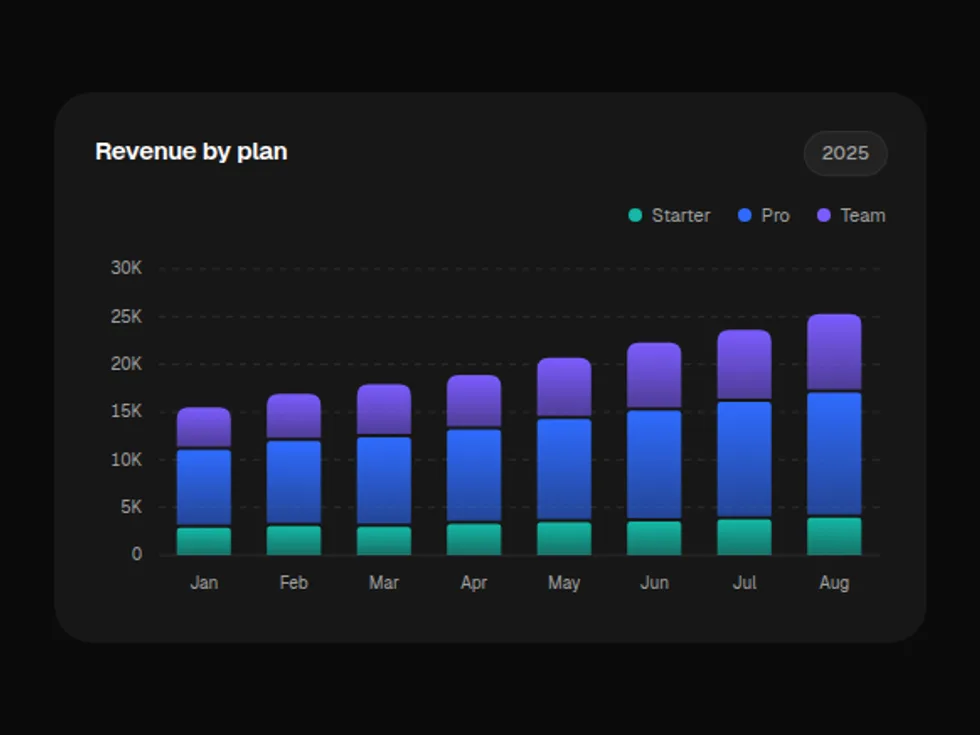
Outlined Stacked Bar Chart
ChartColumns of stacked segments that rise together, with every series and the total in the tooltip — hairline outlines over a faint tint.
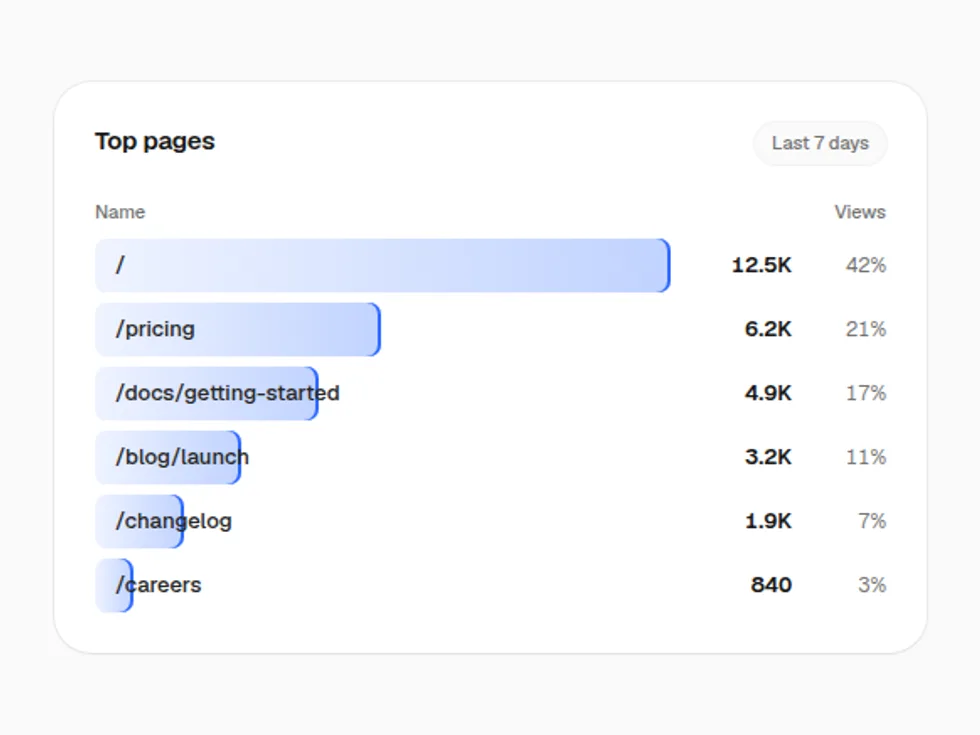

Gradient Horizontal Bar Chart
ChartA ranked list of bars that slide out one after another, label inside and value at the end — soft gradient fills that fade into the floor.
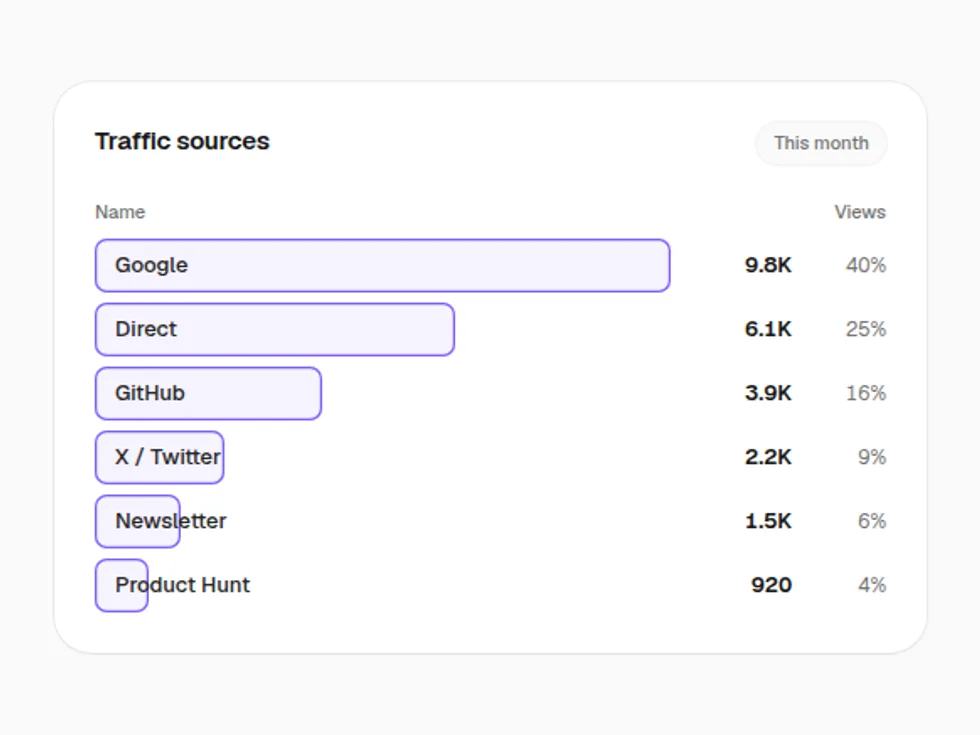

Outlined Horizontal Bar Chart
ChartA ranked list of bars that slide out one after another, label inside and value at the end — hairline outlines over a faint tint.
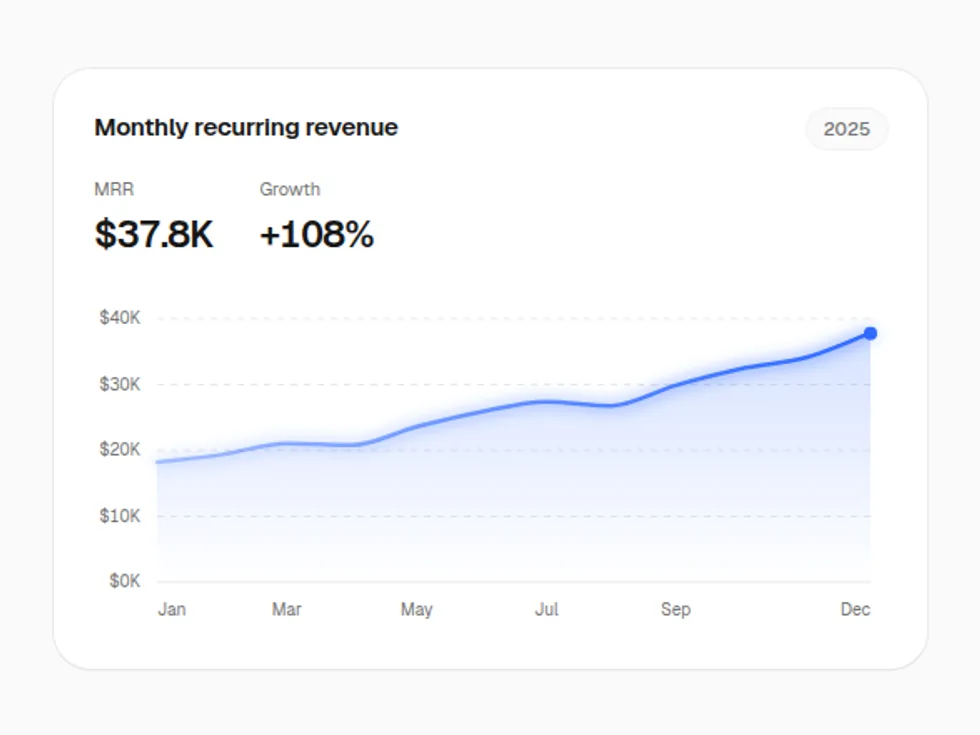
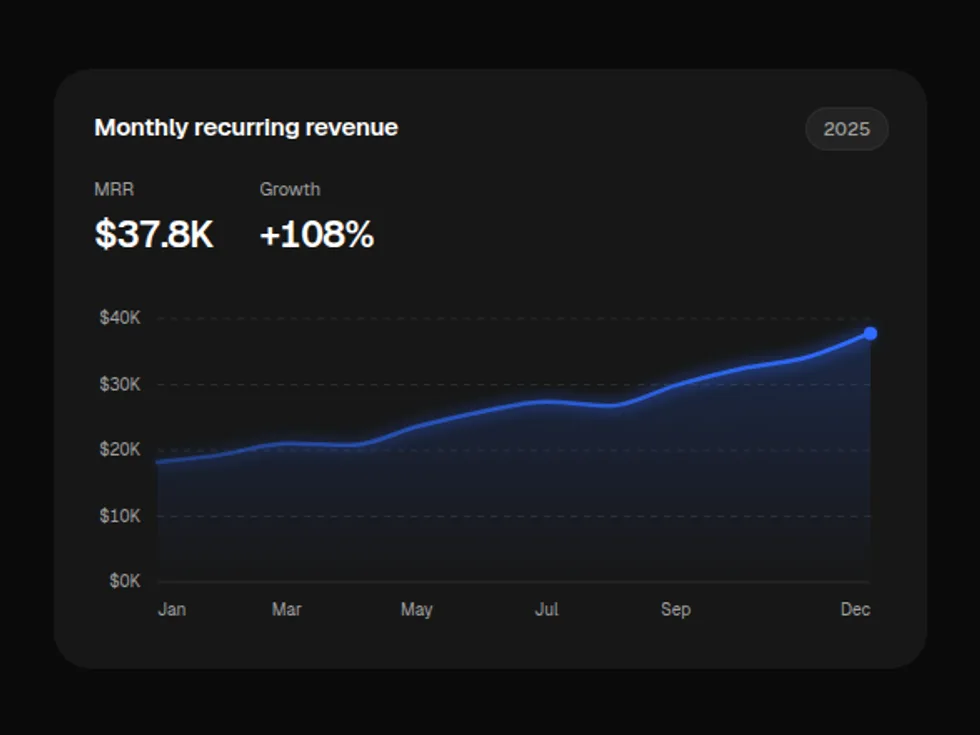
Gradient Line Chart
ChartSmooth lines that draw in from the left, with a crosshair tooltip across every series — soft gradient fills that fade into the floor.
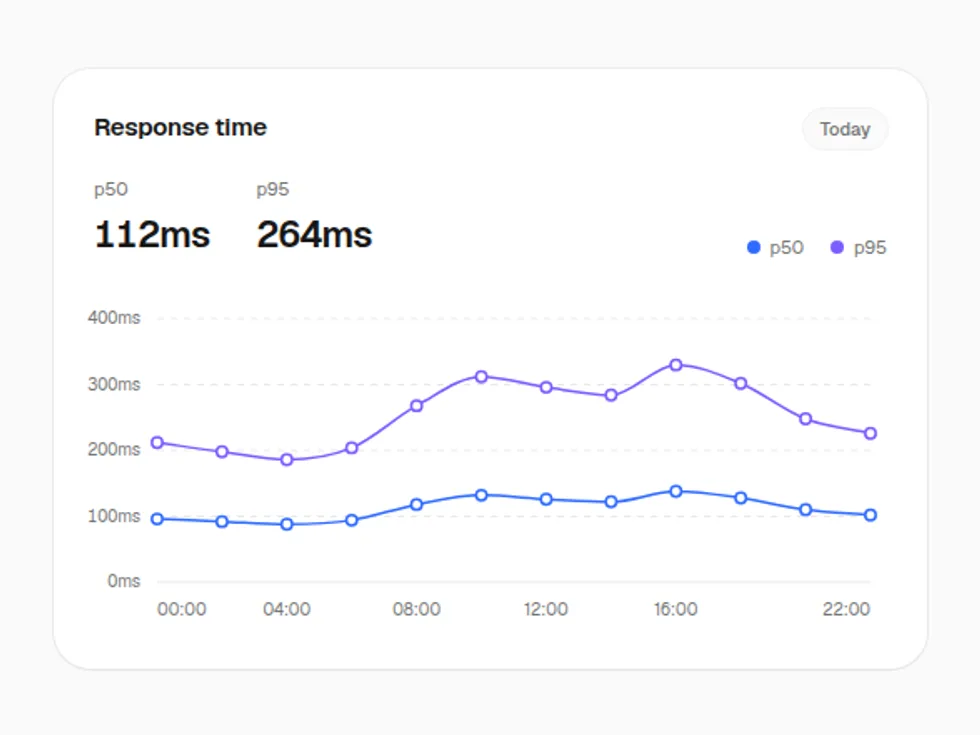
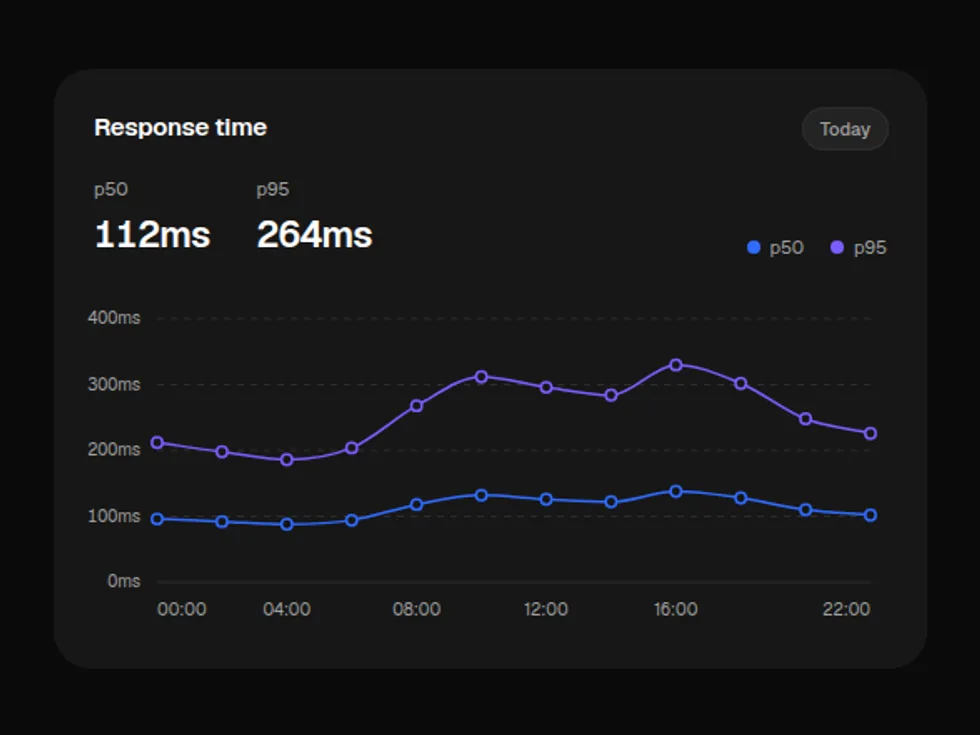
Outlined Line Chart
ChartSmooth lines that draw in from the left, with a crosshair tooltip across every series — hairline outlines over a faint tint.
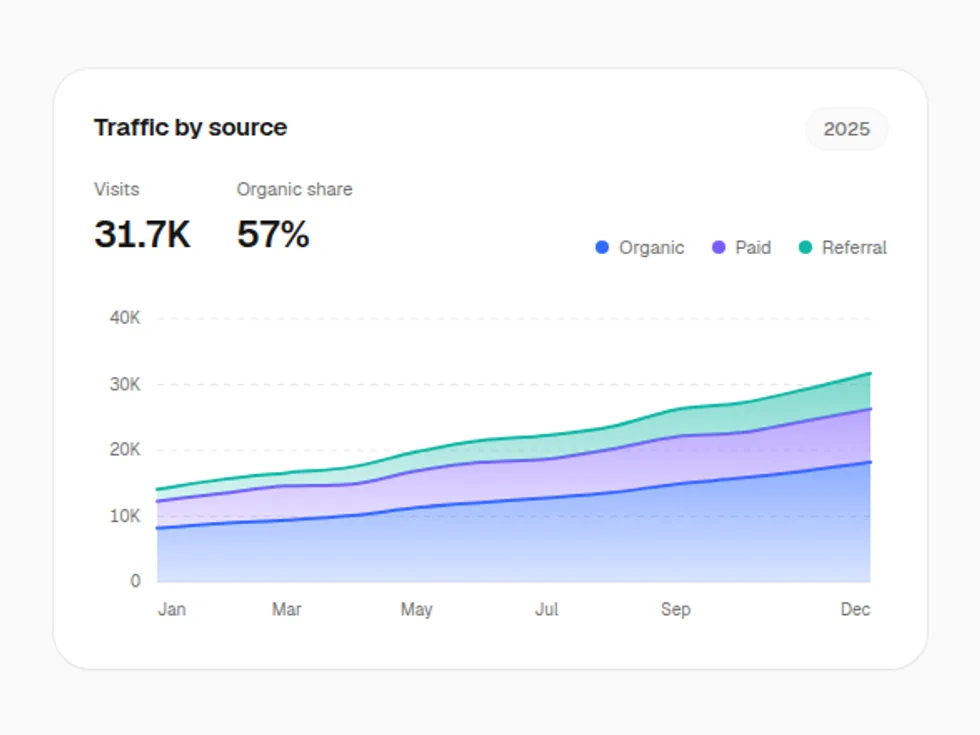
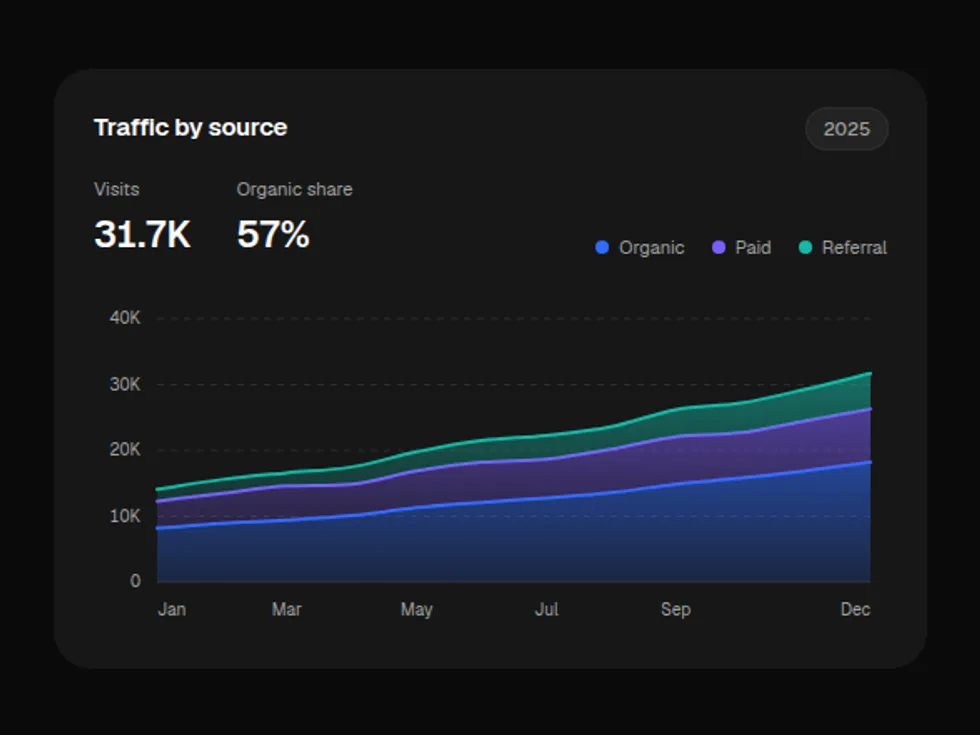
Gradient Area Chart
ChartFilled trends that sweep in from the left, overlapping or stacked, with a crosshair tooltip — soft gradient fills that fade into the floor.
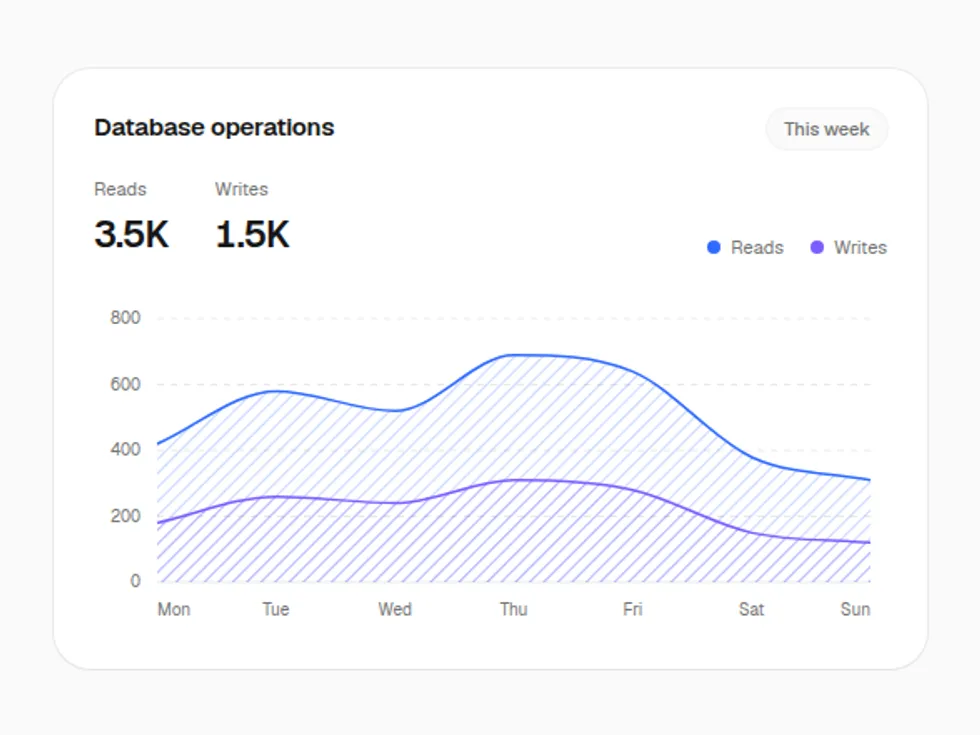
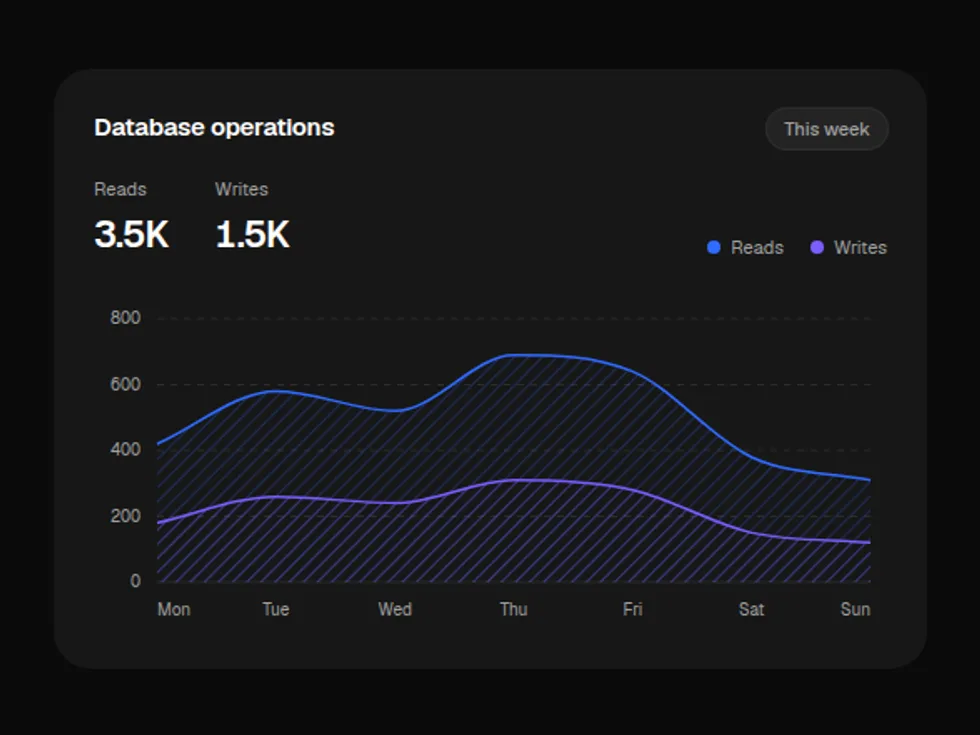
Outlined Area Chart
ChartFilled trends that sweep in from the left, overlapping or stacked, with a crosshair tooltip — hairline outlines over a faint tint.
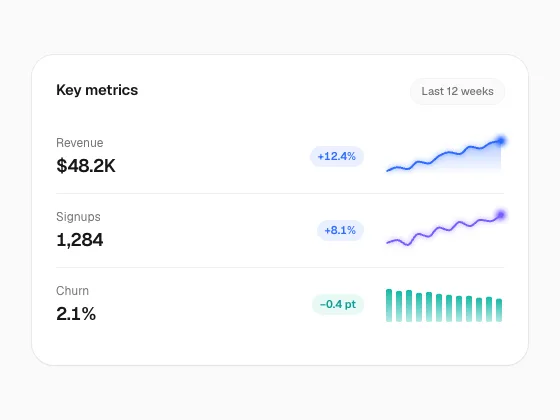
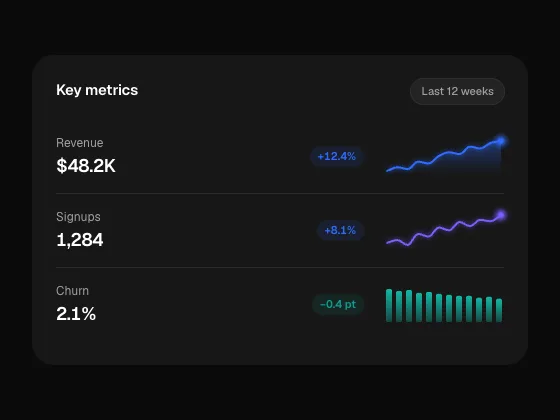
Gradient Spark Chart
ChartWord-sized line, area or bar trends for stat cards and table rows — soft gradient fills that fade into the floor.
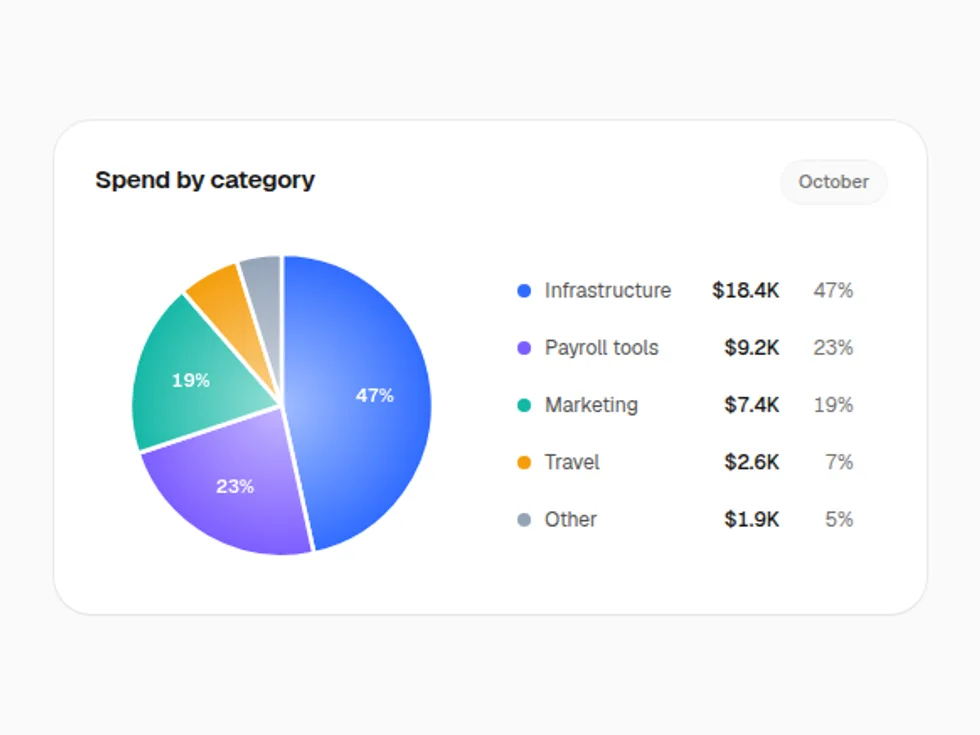
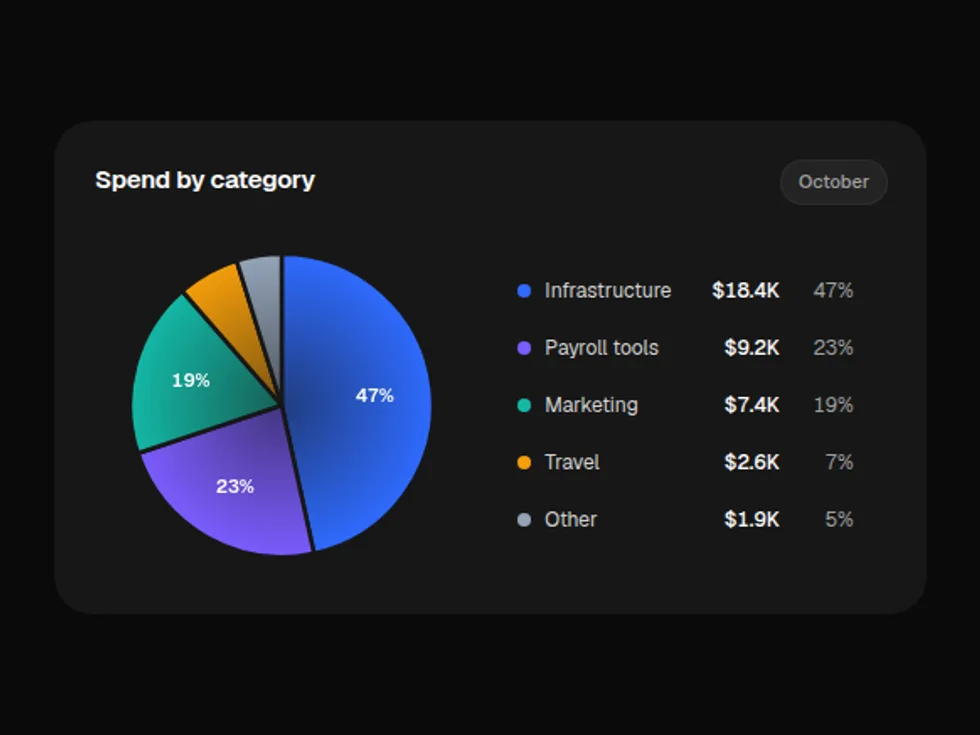
Gradient Pie Chart
ChartWedges with thin gaps that sweep in clockwise; hovering pops a wedge outward — soft gradient fills that fade into the floor.
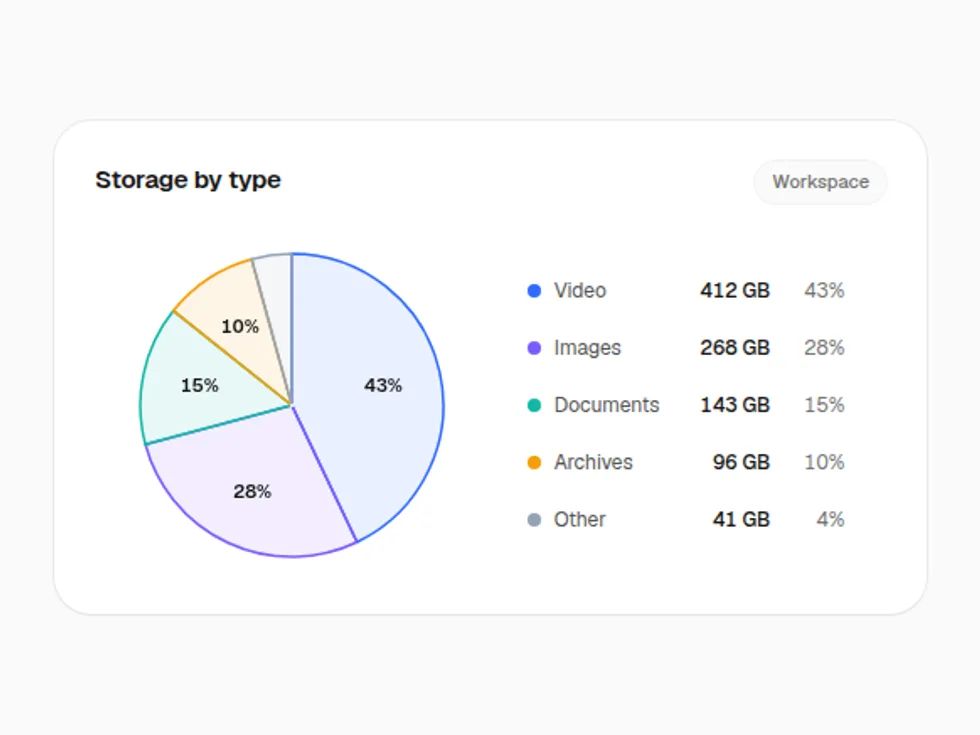
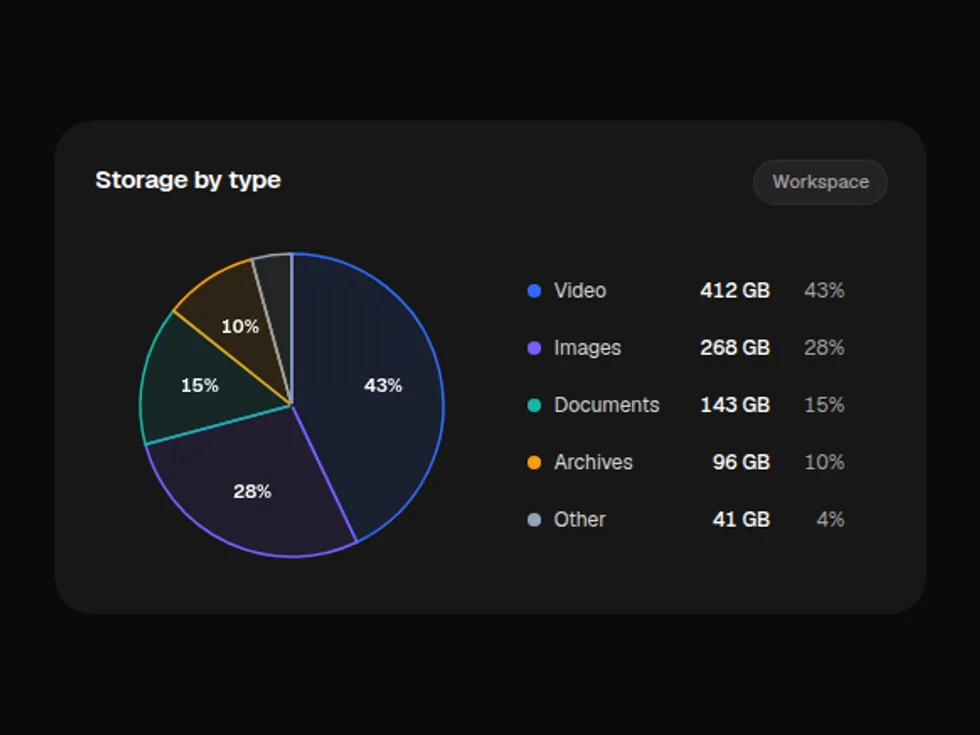
Outlined Pie Chart
ChartWedges with thin gaps that sweep in clockwise; hovering pops a wedge outward — hairline outlines over a faint tint.

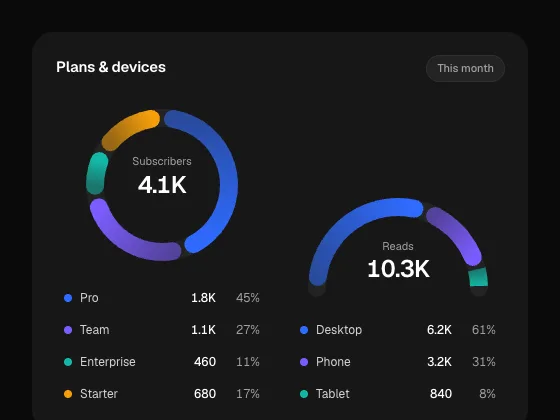
Gradient Donut Chart
ChartA ring or semi-circle gauge of rounded segments that sweep in one after another, with the hovered value in the middle — soft gradient fills that fade into the floor.
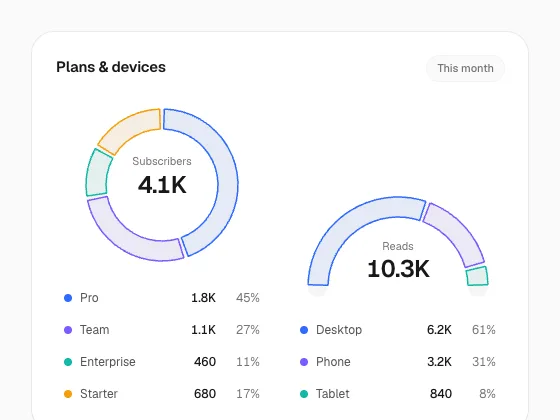
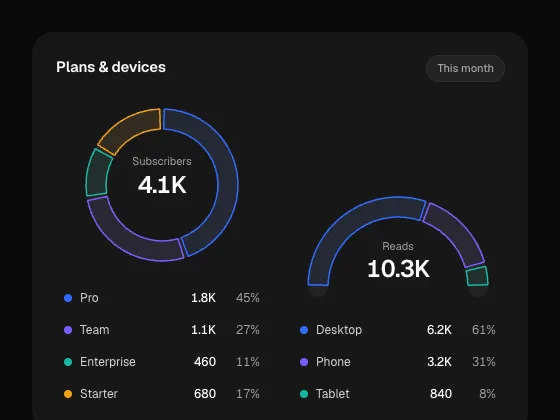
Outlined Donut Chart
ChartA ring or semi-circle gauge of rounded segments that sweep in one after another, with the hovered value in the middle — hairline outlines over a faint tint.
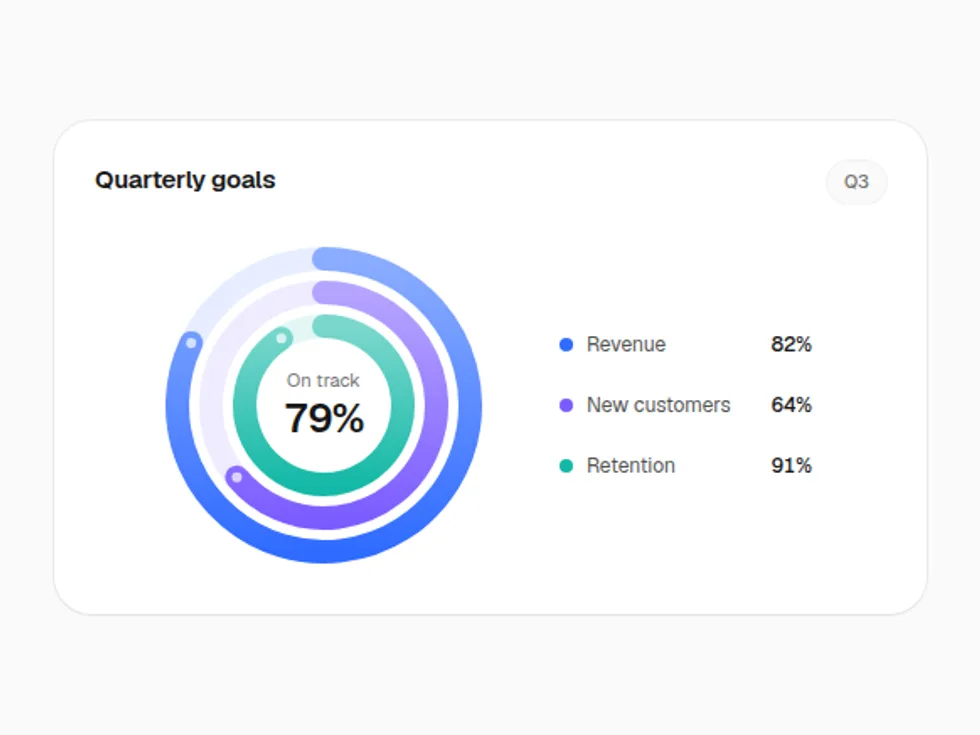
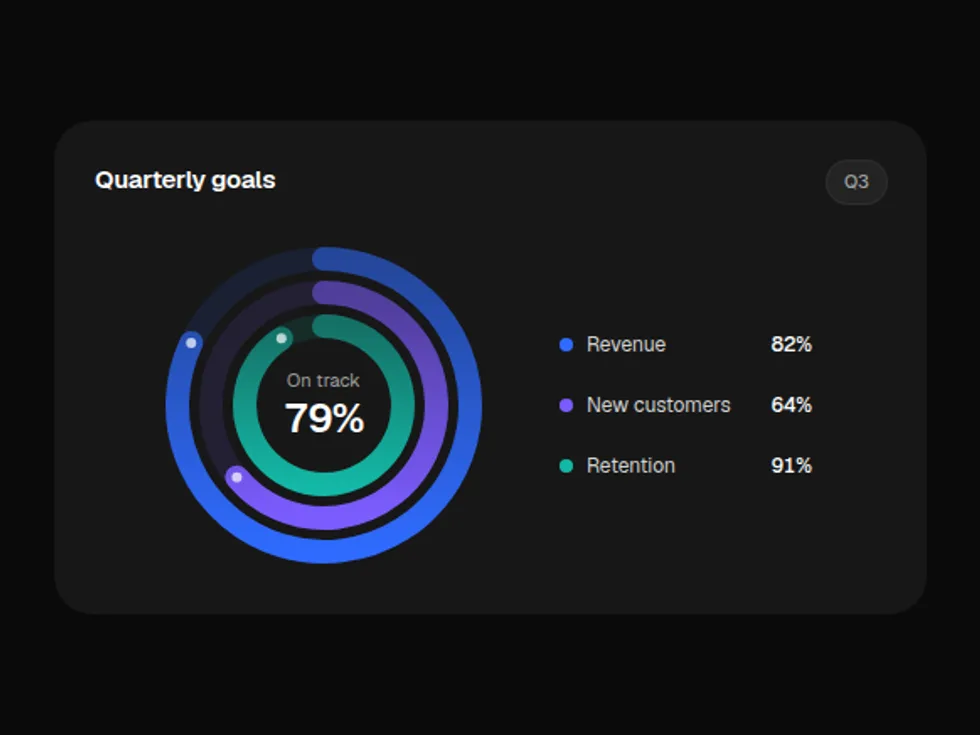
Gradient Radial Chart
ChartConcentric progress rings that fill clockwise one after another, with a centre readout and legend — soft gradient fills that fade into the floor.
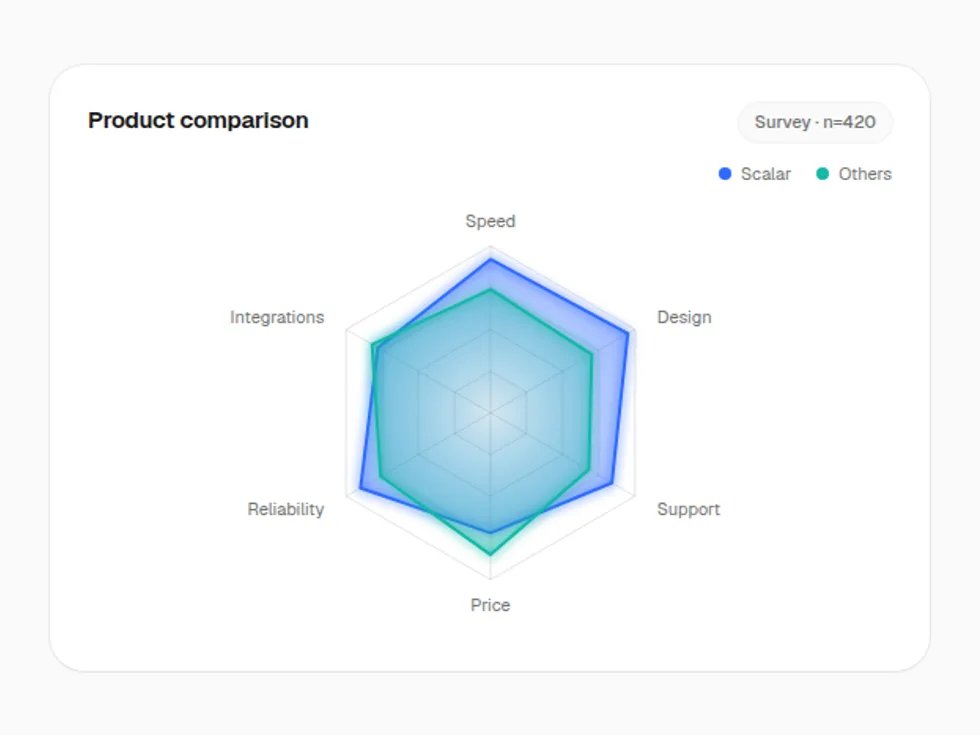
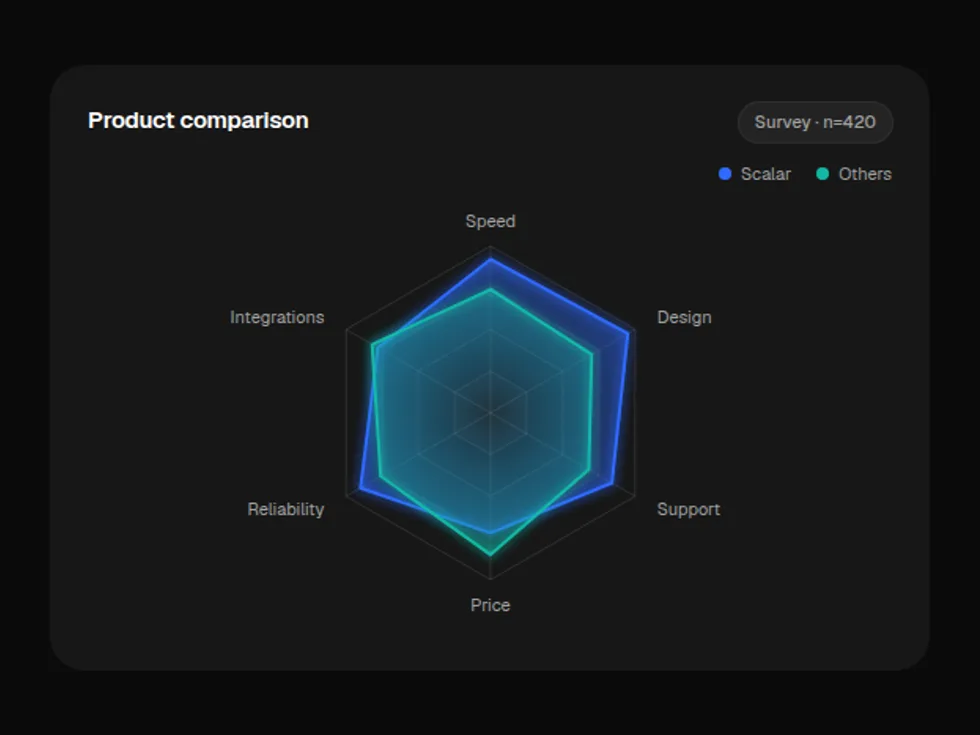
Gradient Hexagon Chart
ChartA radar chart on a hexagonal grid; each series grows out of the centre — soft gradient fills that fade into the floor.
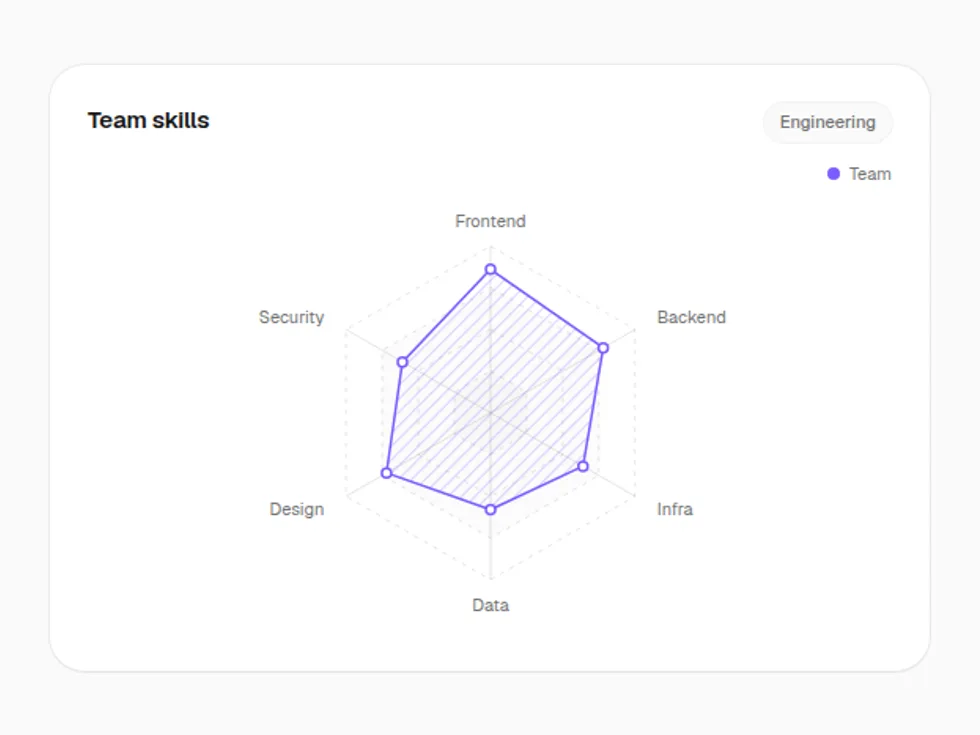
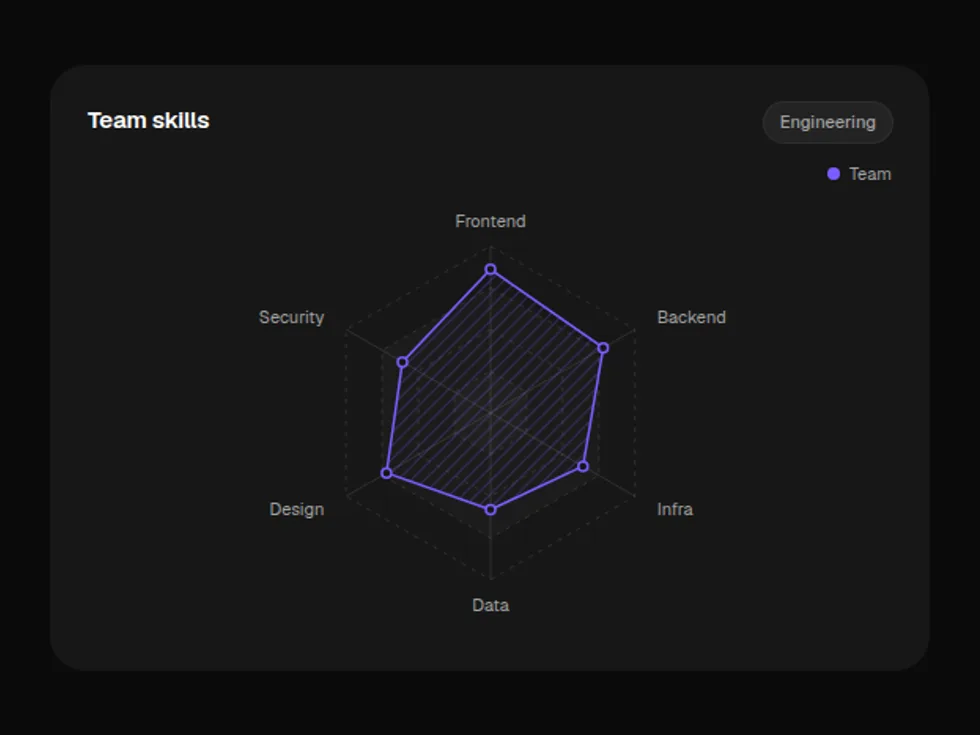
Outlined Hexagon Chart
ChartA radar chart on a hexagonal grid; each series grows out of the centre — hairline outlines over a faint tint.
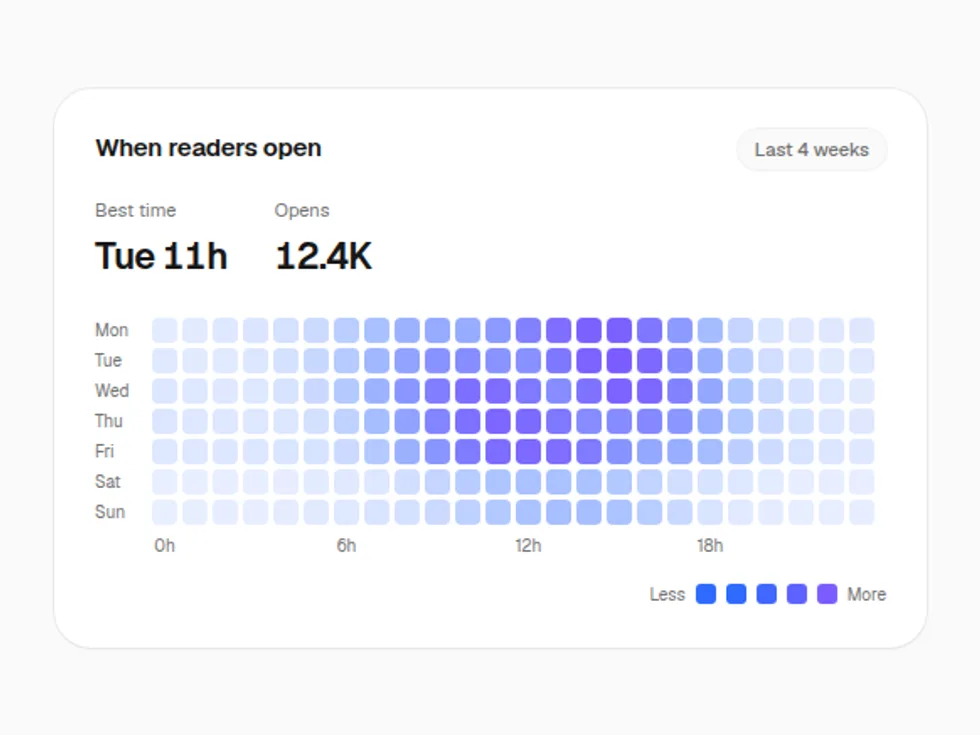
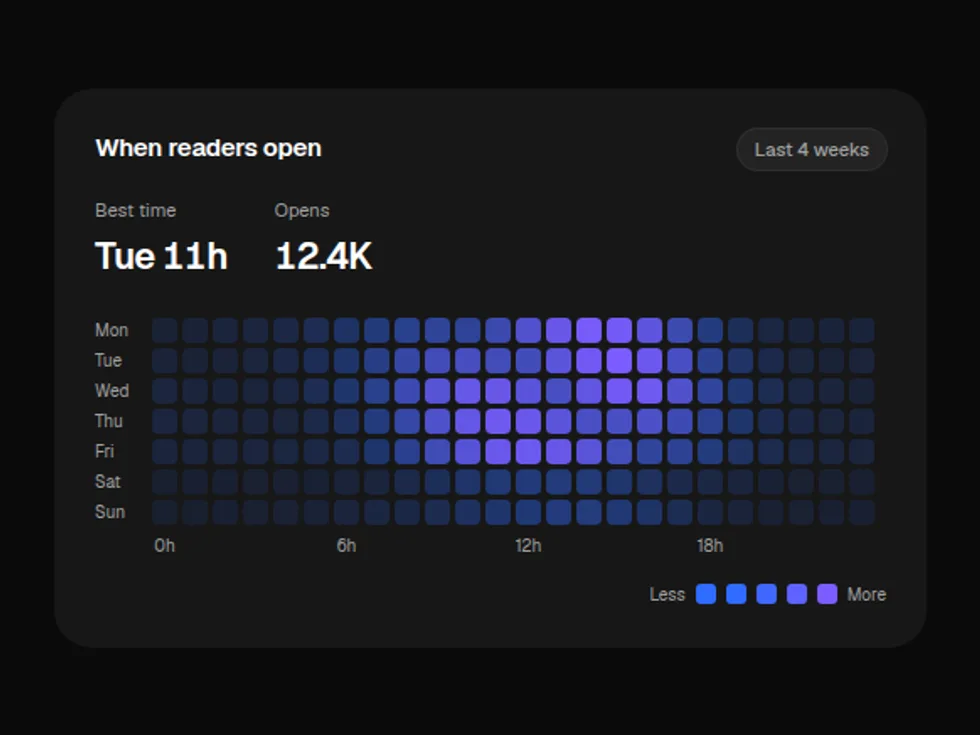
Gradient Heatmap
ChartA grid shaded by value that cascades in diagonally, with a row-and-column crosshair on hover — soft gradient fills that fade into the floor.
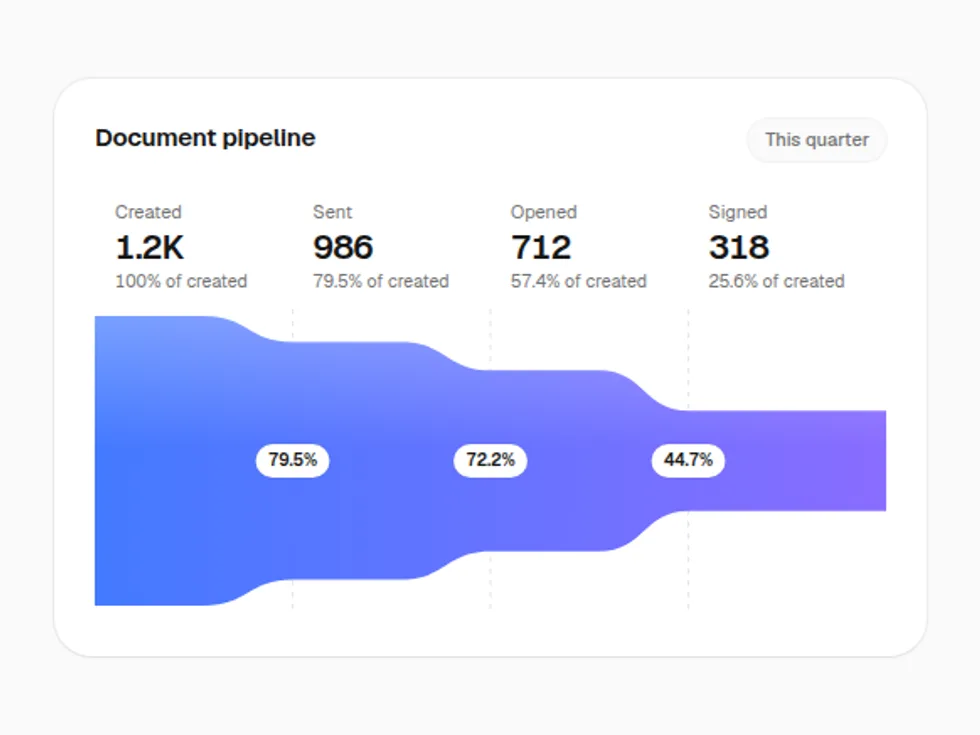
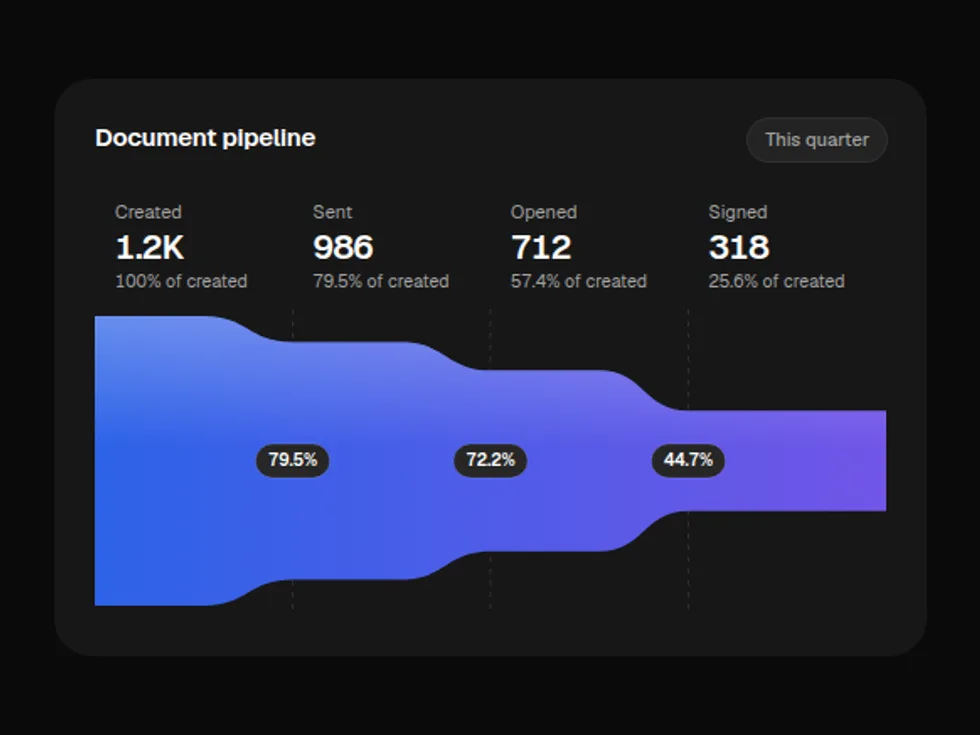
Gradient Funnel Chart
ChartOne band that narrows stage by stage, with counts, shares and step-conversion pills — soft gradient fills that fade into the floor.
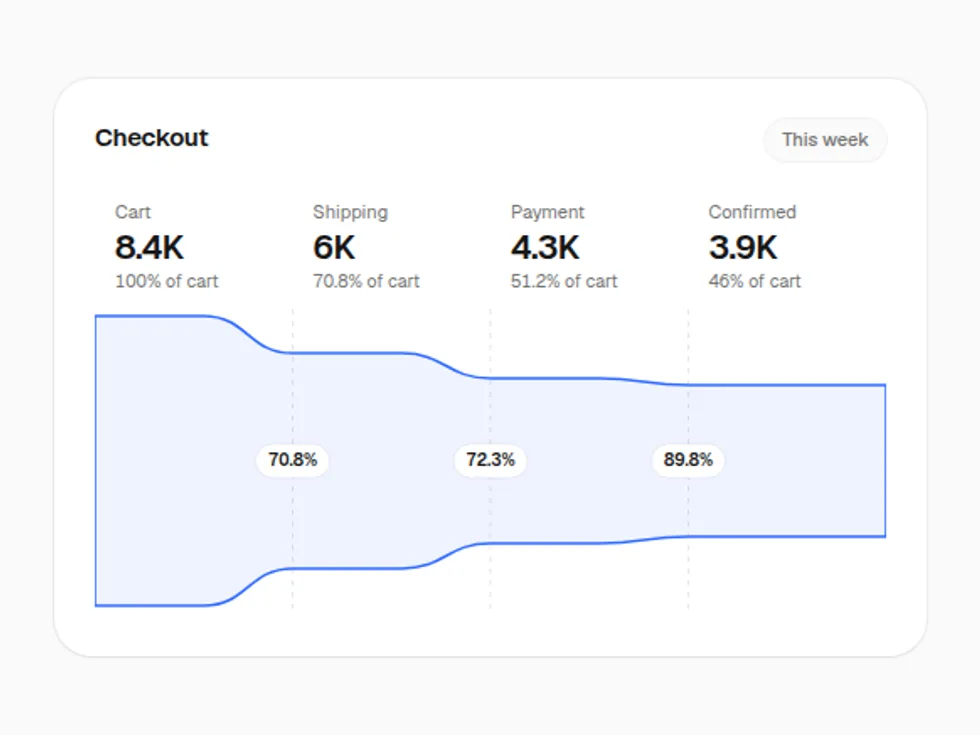
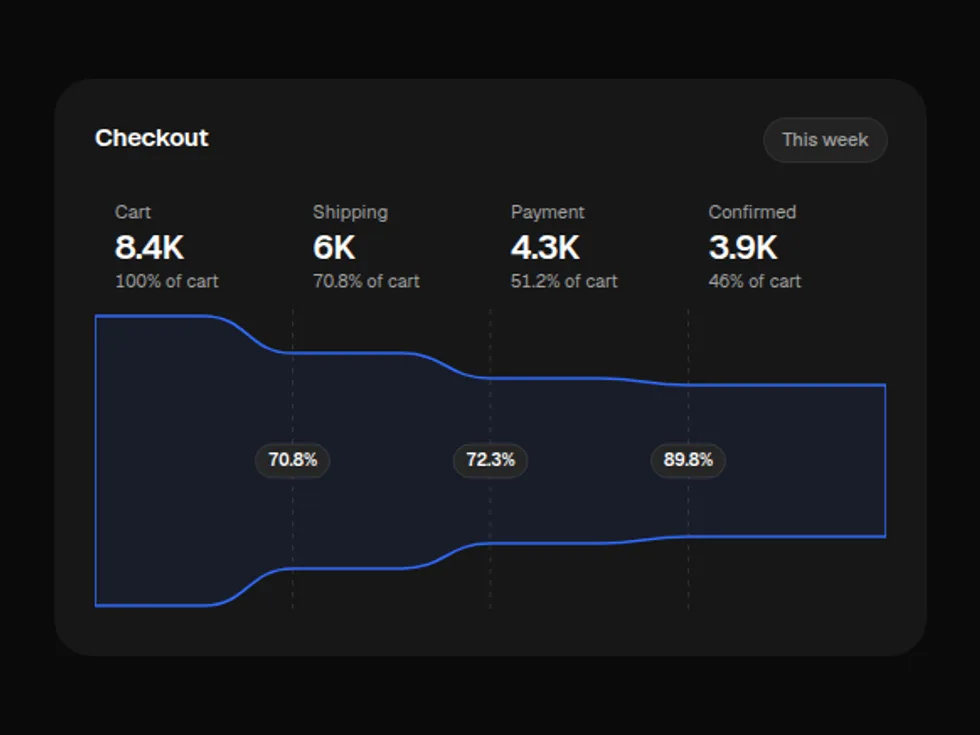
Outlined Funnel Chart
ChartOne band that narrows stage by stage, with counts, shares and step-conversion pills — hairline outlines over a faint tint.
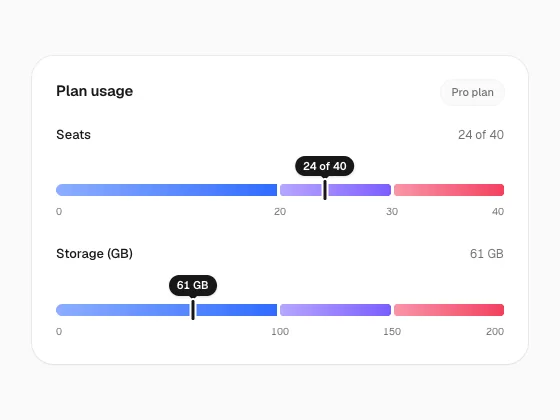
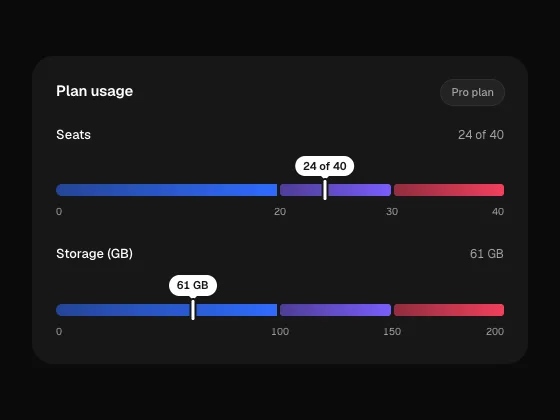
Gradient Category Bar
ChartOne bar divided into coloured ranges, with a marker that slides to the current value — soft gradient fills that fade into the floor.
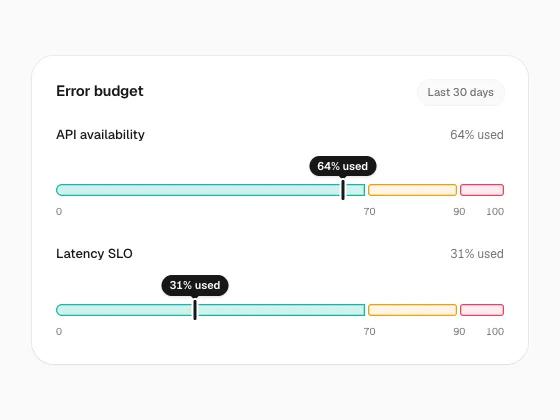
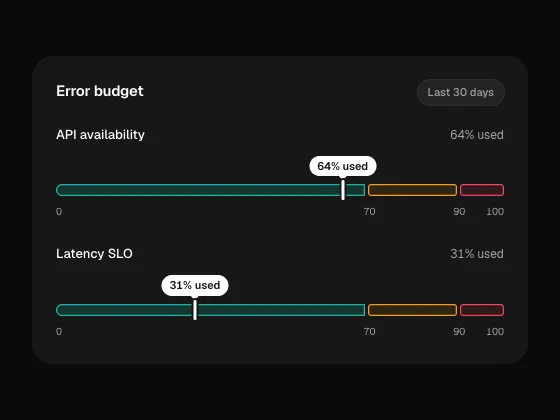
Outlined Category Bar
ChartOne bar divided into coloured ranges, with a marker that slides to the current value — hairline outlines over a faint tint.
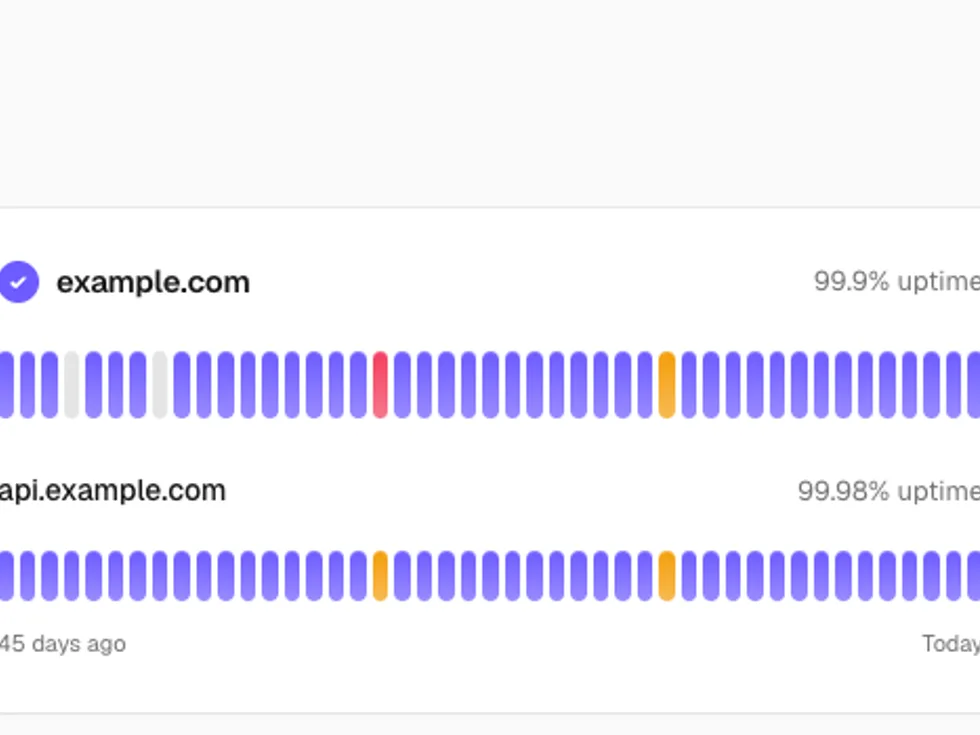
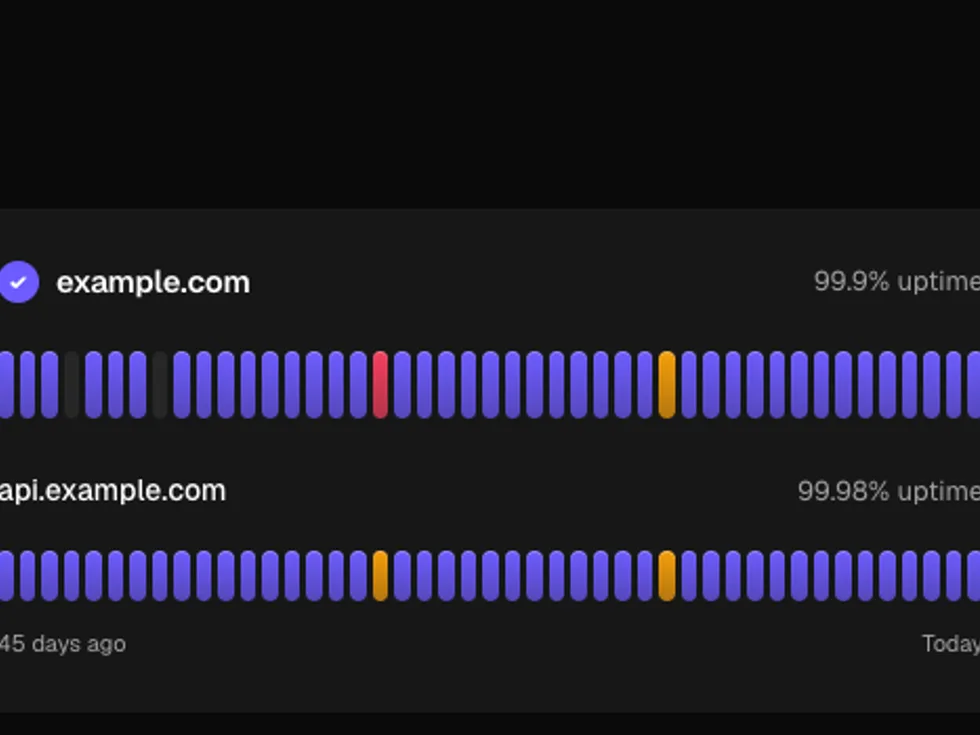
Gradient Segmented Progress
ChartA row of status blocks — uptime, streaks, steps — that pop up left to right with tooltips — soft gradient fills that fade into the floor.
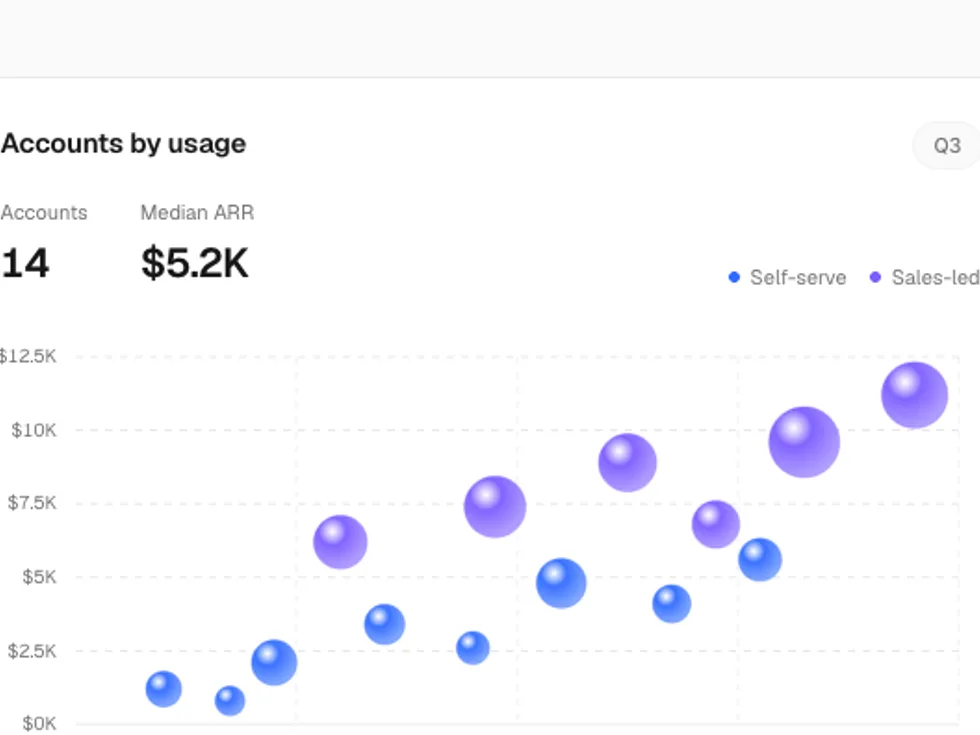
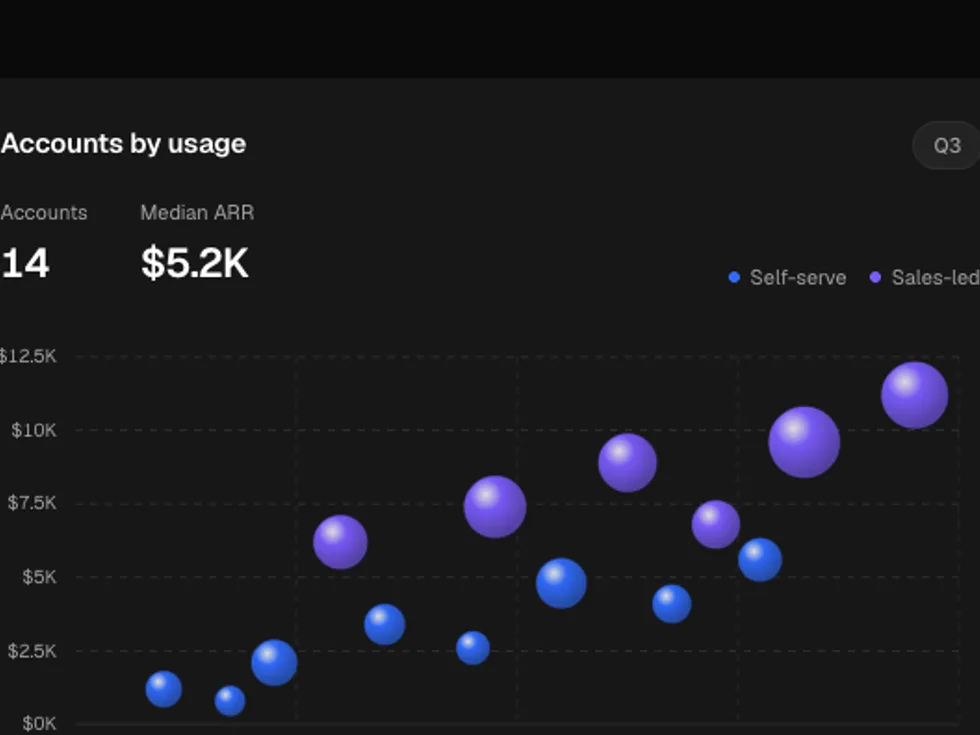
Gradient Scatter Chart
ChartPoints or bubbles that pop in left to right on a dashed grid; hovering finds the nearest point and drops guides to both axes — soft gradient fills that fade into the floor.
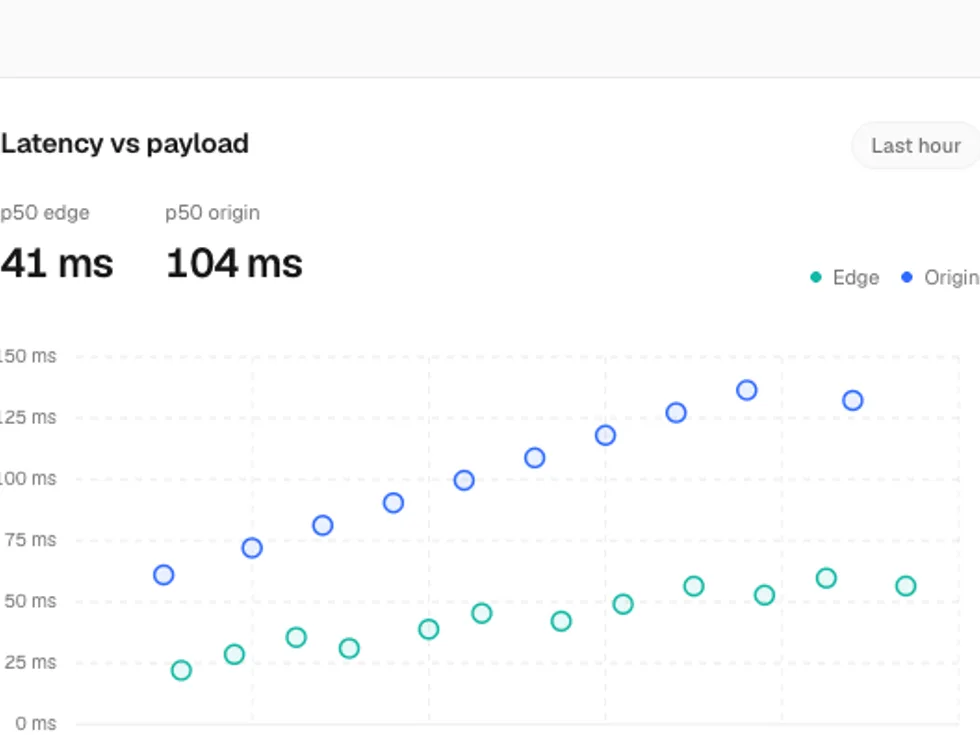
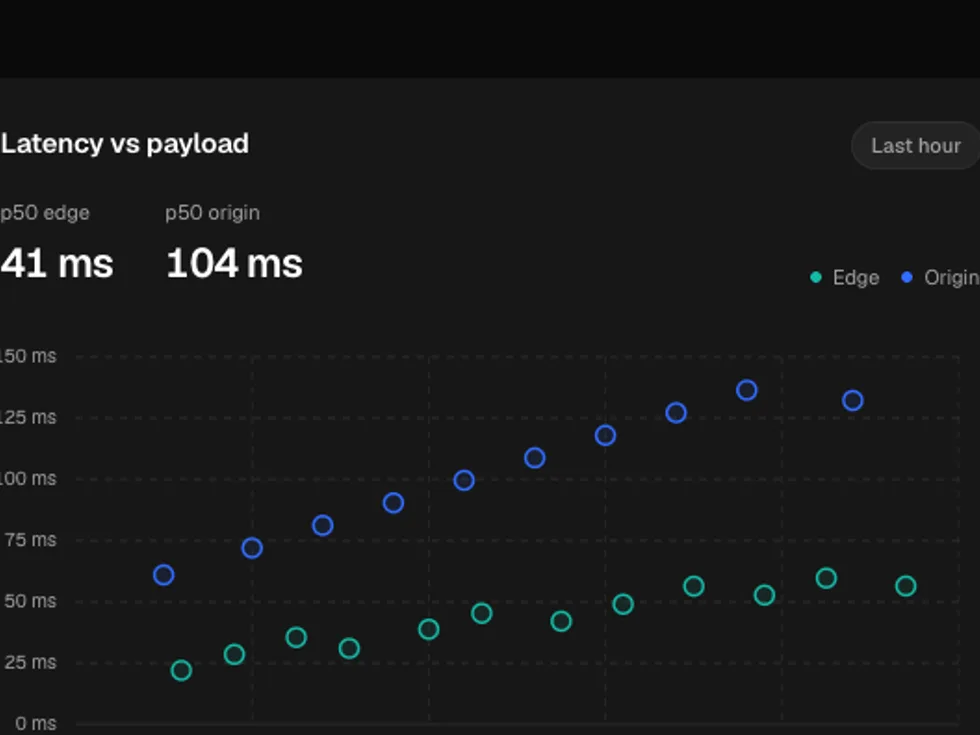
Outlined Scatter Chart
ChartPoints or bubbles that pop in left to right on a dashed grid; hovering finds the nearest point and drops guides to both axes — hairline outlines over a faint tint.
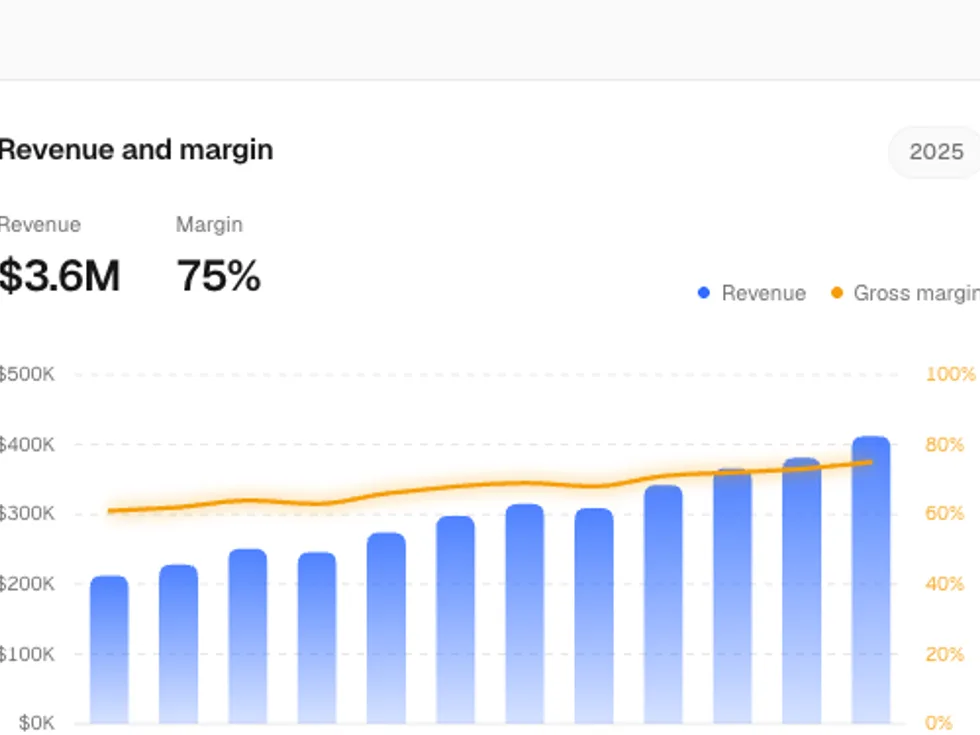
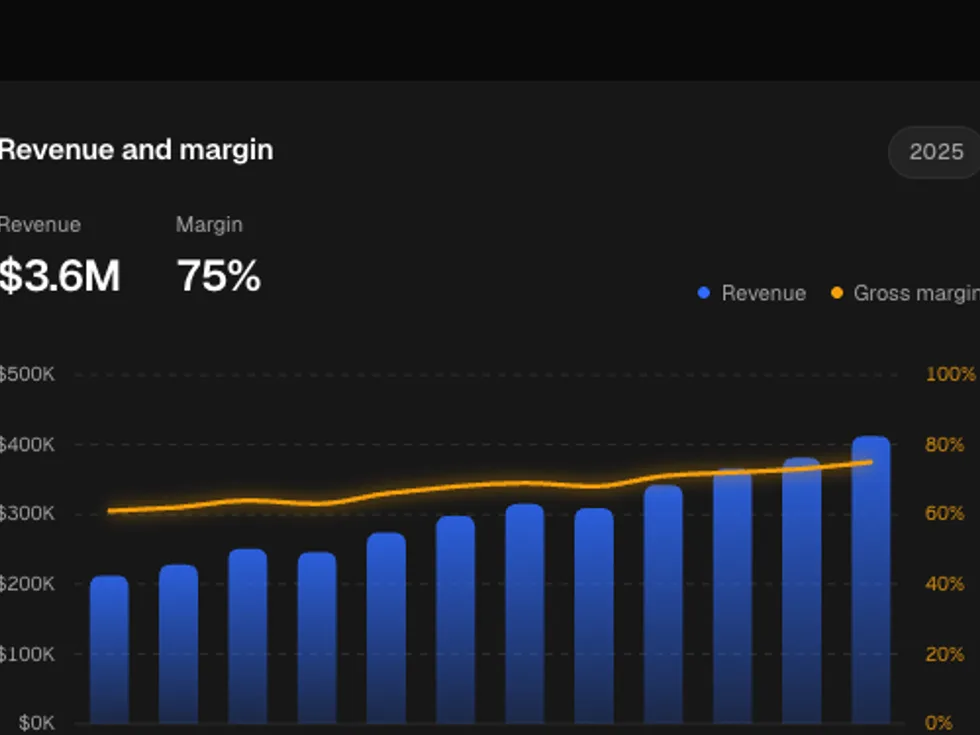
Gradient Combo Chart
ChartColumns and a smooth line on their own axes; columns spring up, then the line draws across them, and hovering lists both — soft gradient fills that fade into the floor.
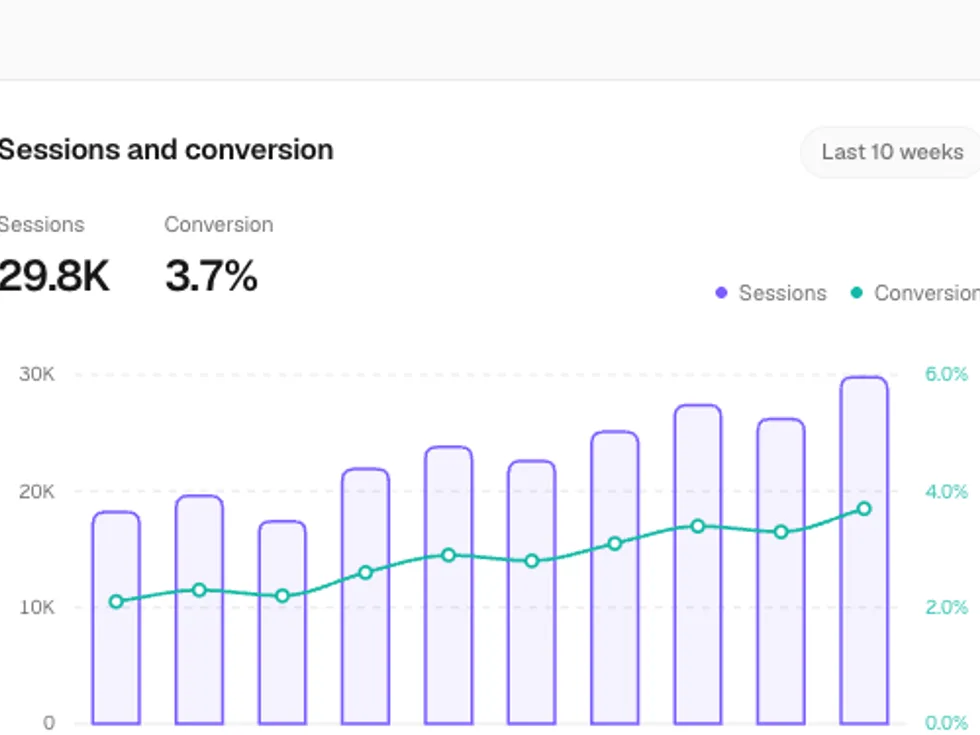
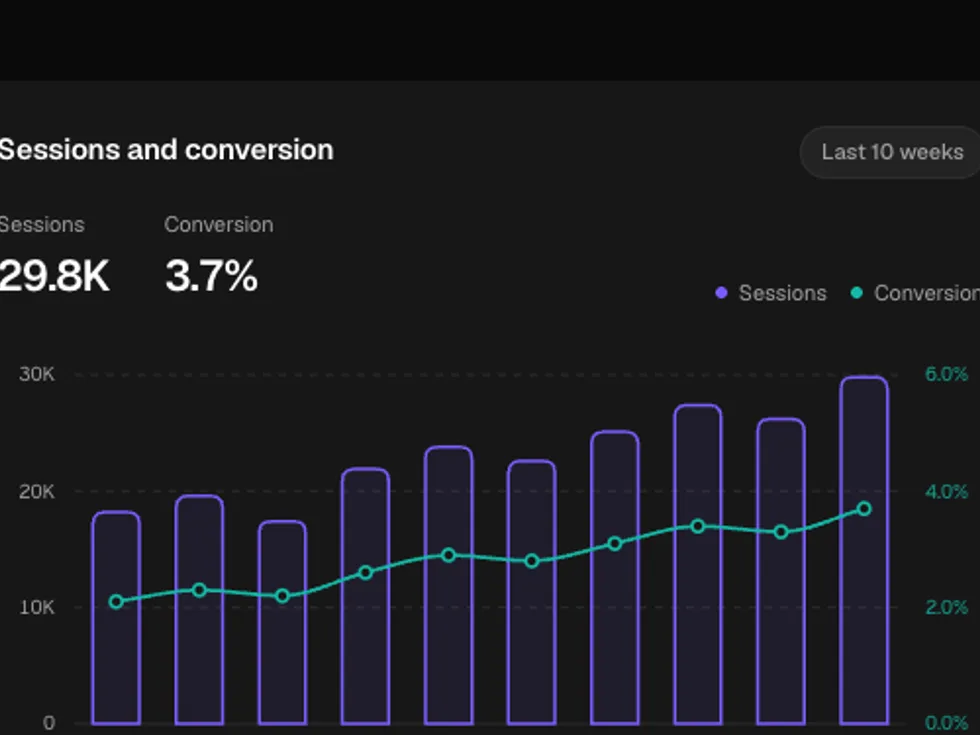
Outlined Combo Chart
ChartColumns and a smooth line on their own axes; columns spring up, then the line draws across them, and hovering lists both — hairline outlines over a faint tint.
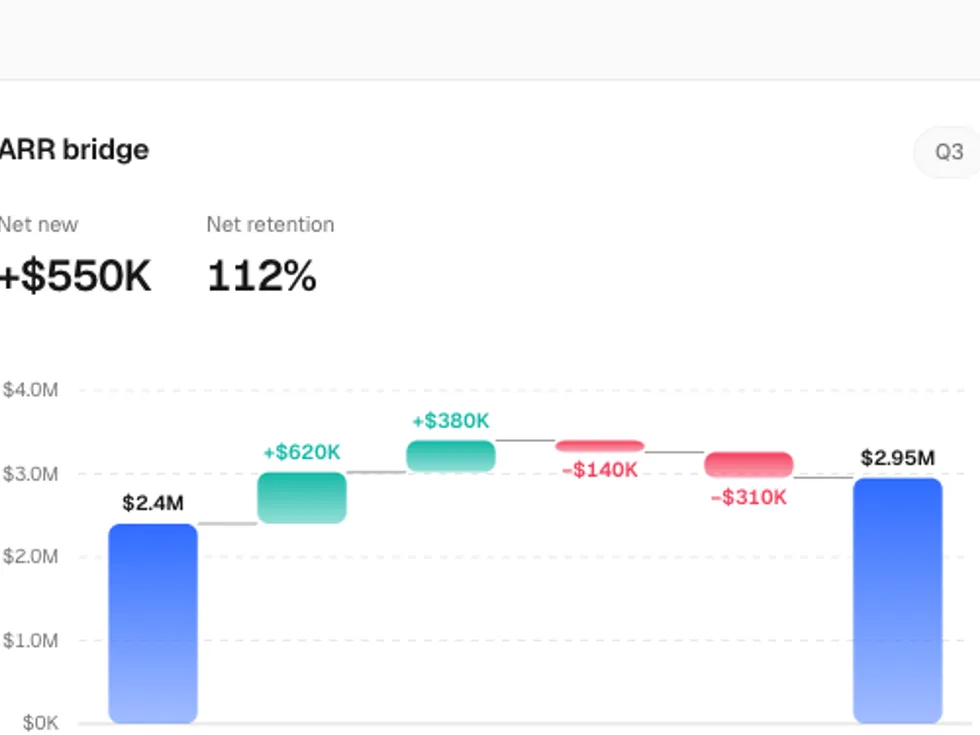
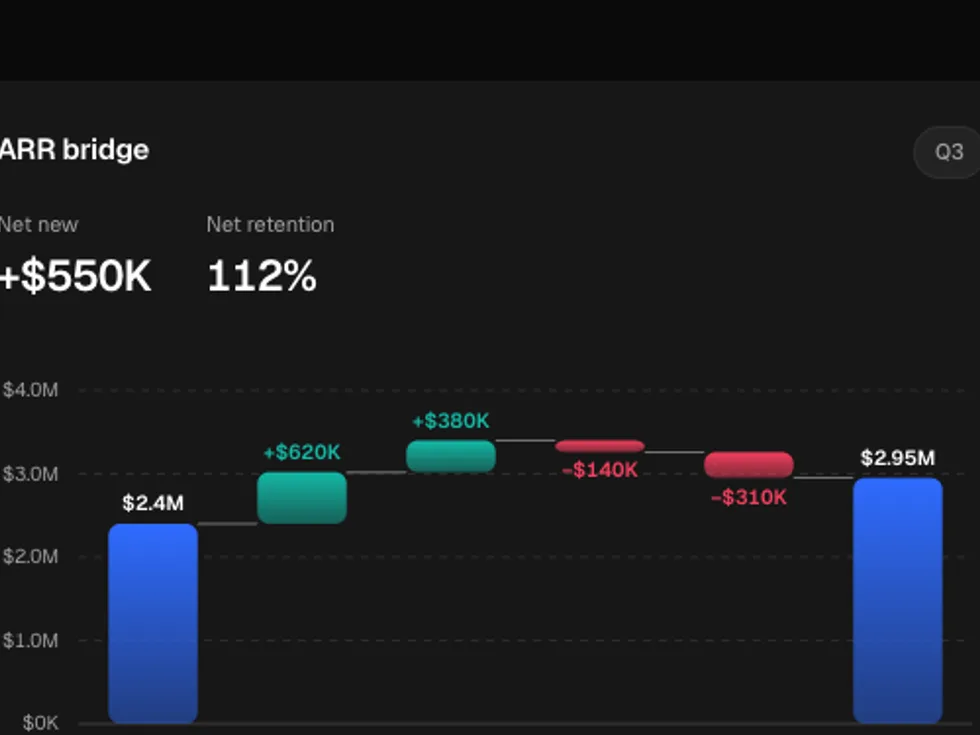
Gradient Waterfall Chart
ChartChanges that float from the running total, joined by dashed connectors, with totals on the floor; columns grow in one after another — soft gradient fills that fade into the floor.
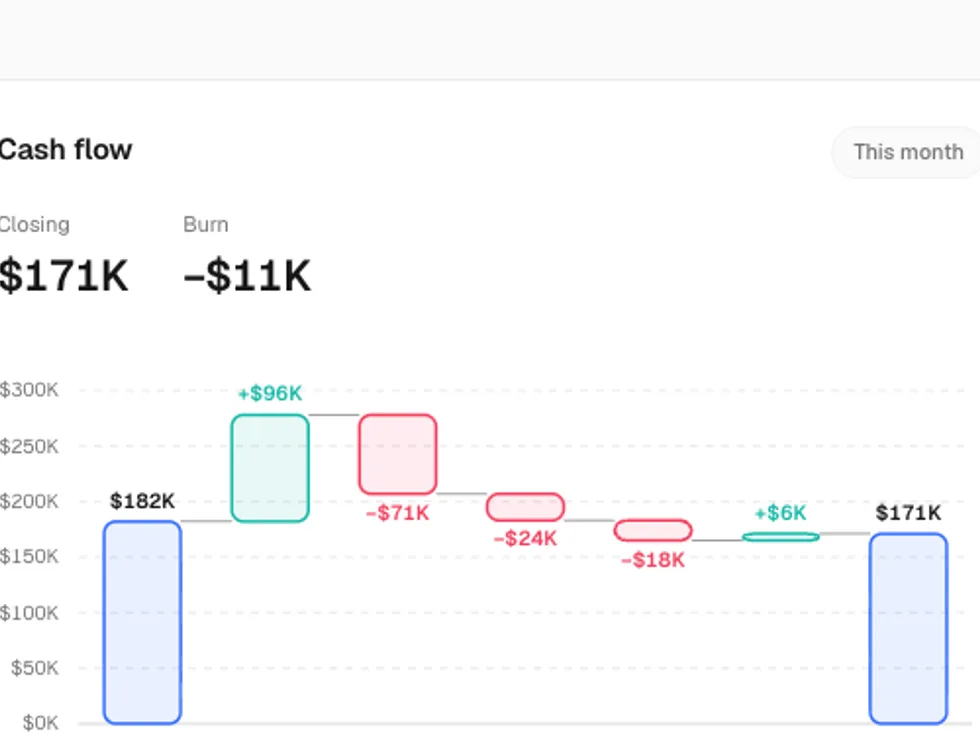
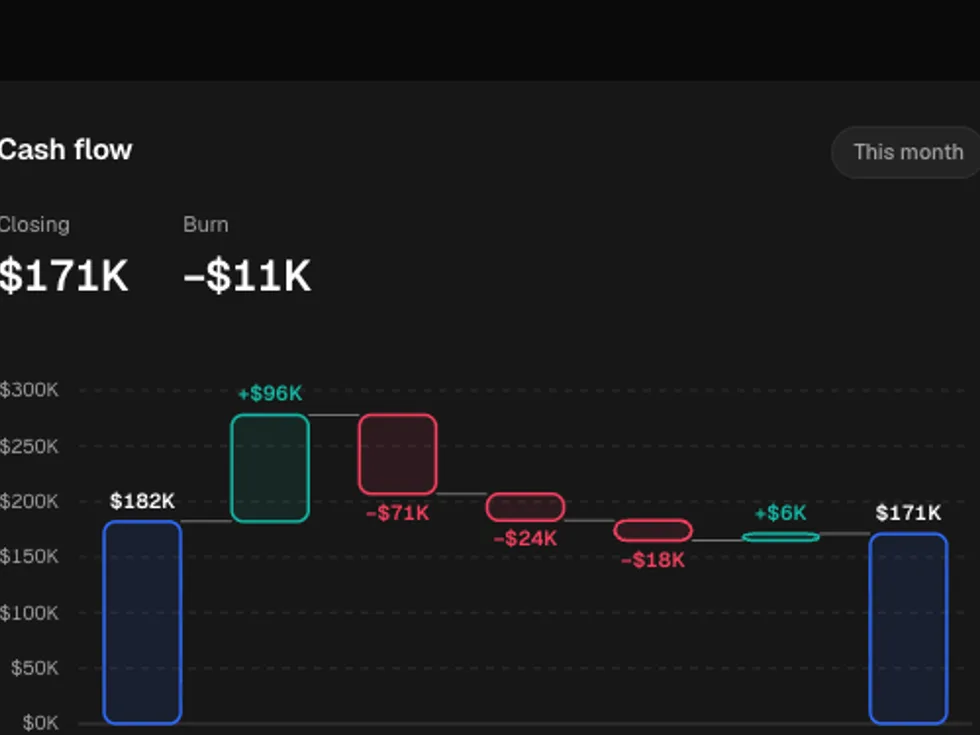
Outlined Waterfall Chart
ChartChanges that float from the running total, joined by dashed connectors, with totals on the floor; columns grow in one after another — hairline outlines over a faint tint.
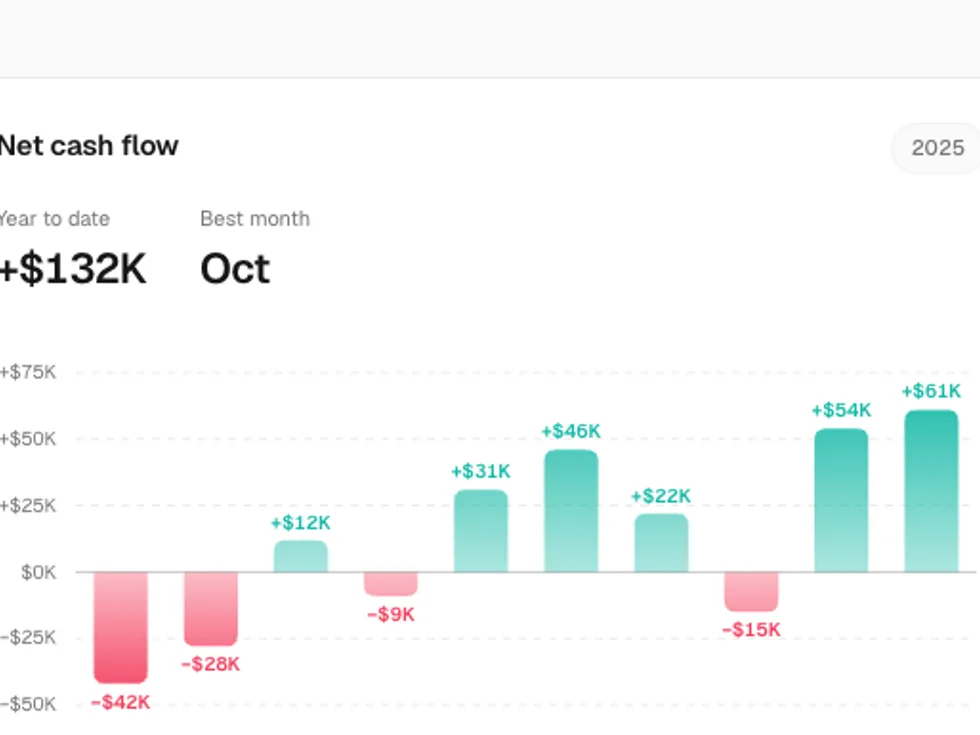
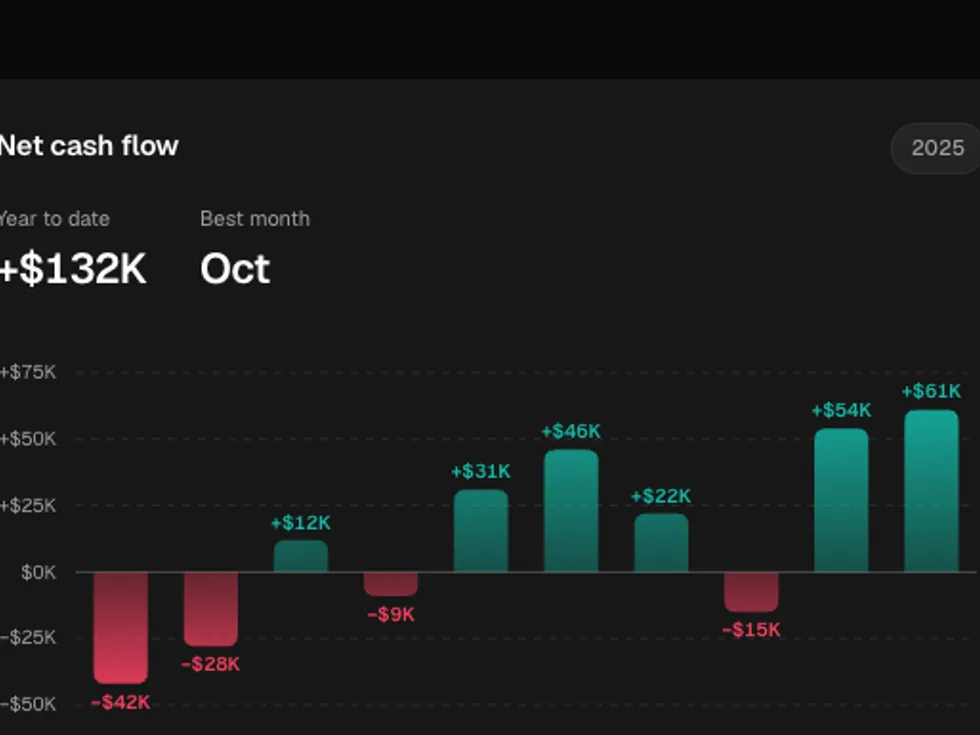
Gradient Diverging Bar Chart
ChartColumns that grow up or down from a zero line in their own colours, with signed values at their ends — soft gradient fills that fade into the floor.
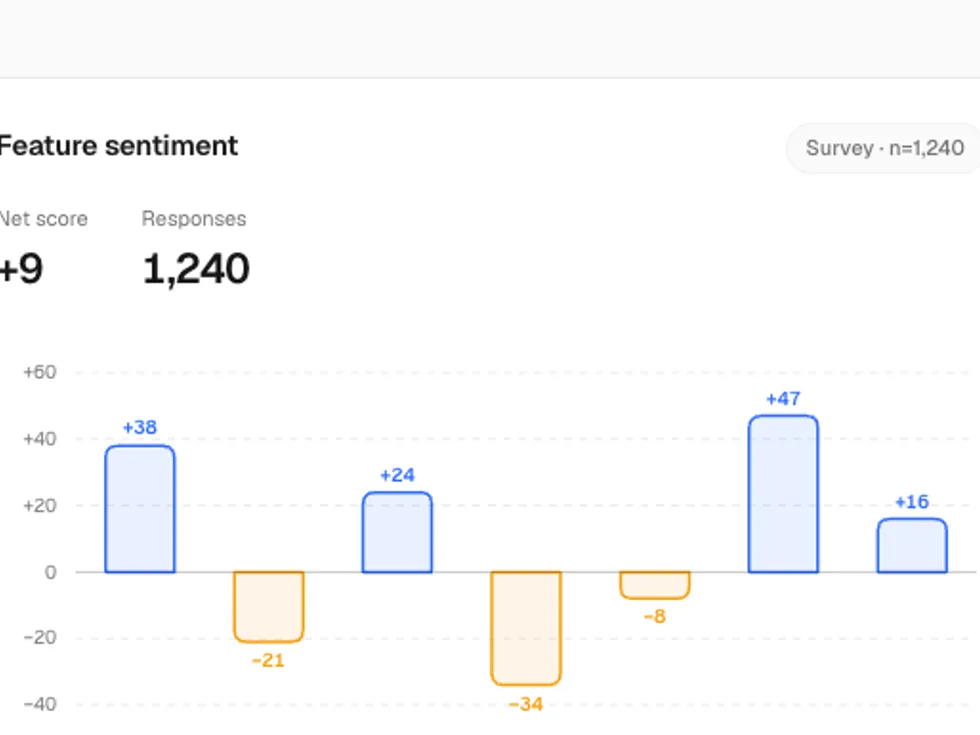
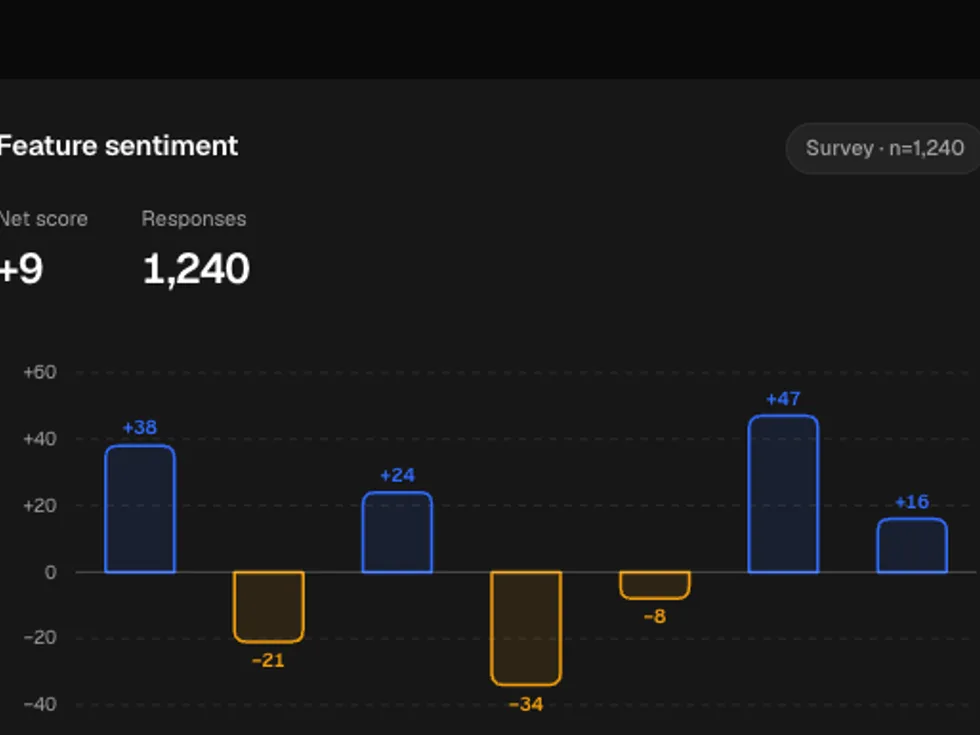
Outlined Diverging Bar Chart
ChartColumns that grow up or down from a zero line in their own colours, with signed values at their ends — hairline outlines over a faint tint.
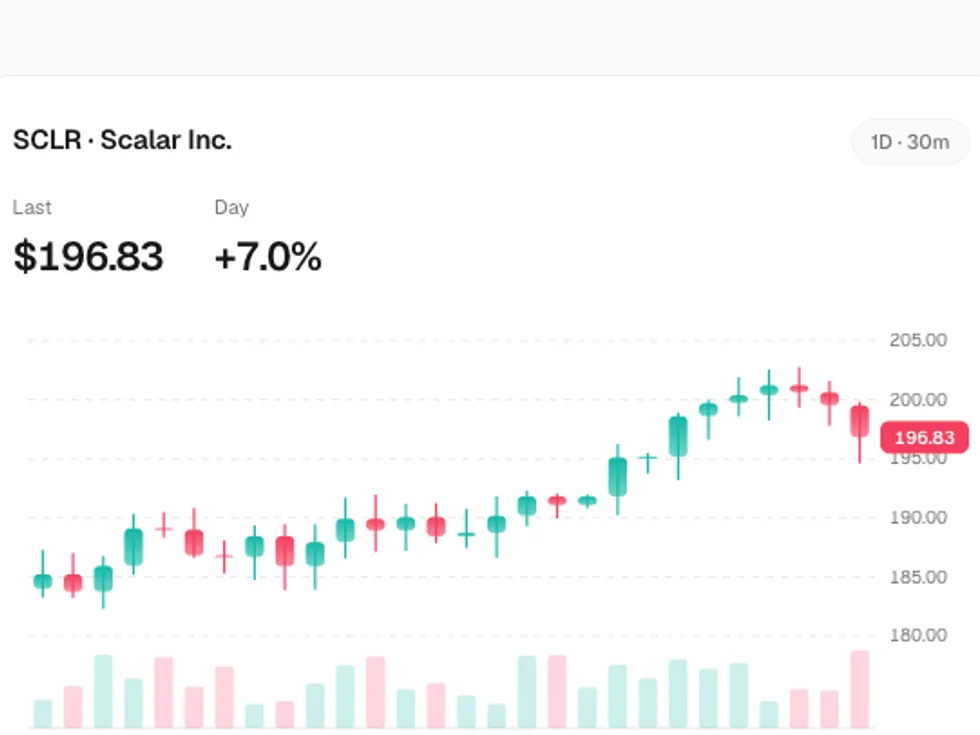

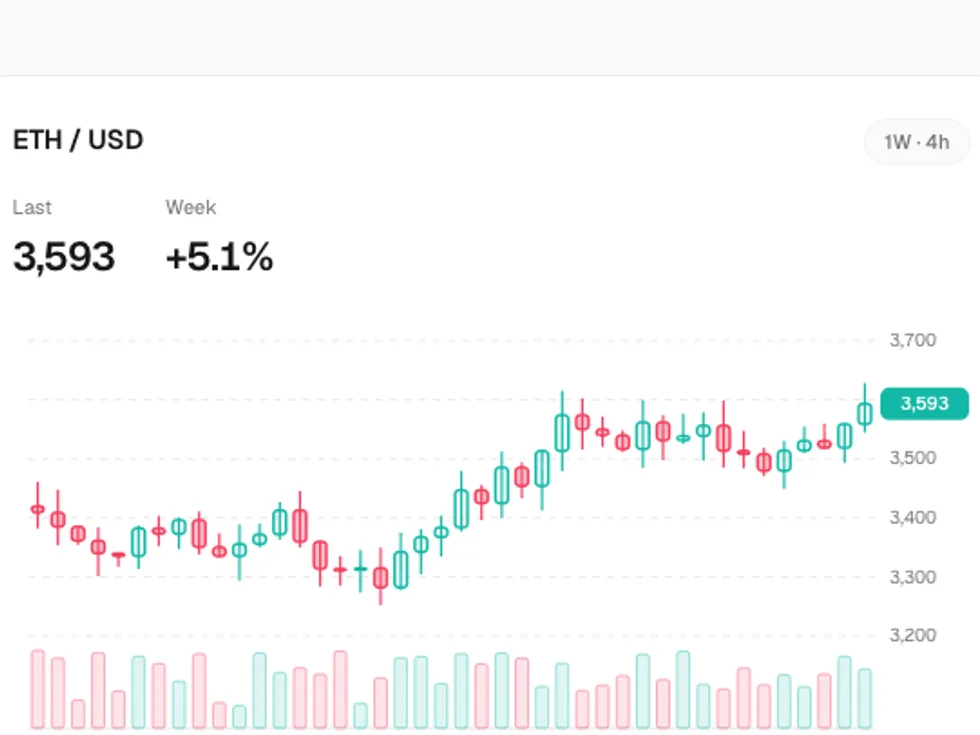
Gradient Candlestick Chart
ChartOpen, high, low and close per period with volume underneath; candles open from their midpoint, and hovering draws a crosshair and tags the close — soft gradient fills that fade into the floor.
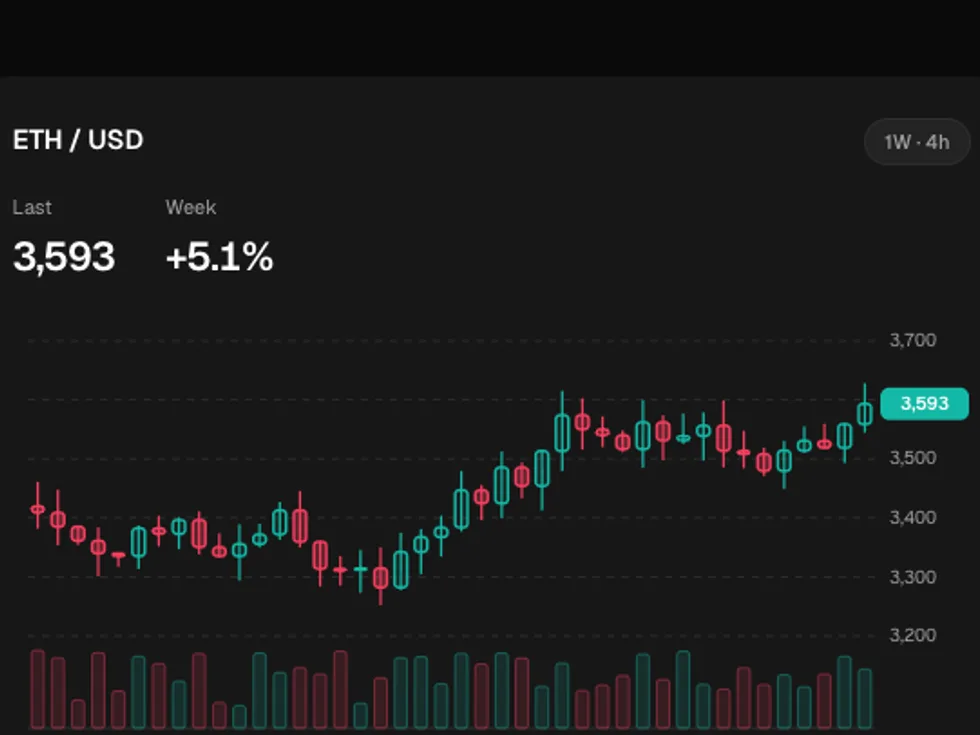
Outlined Candlestick Chart
ChartOpen, high, low and close per period with volume underneath; candles open from their midpoint, and hovering draws a crosshair and tags the close — hairline outlines over a faint tint.
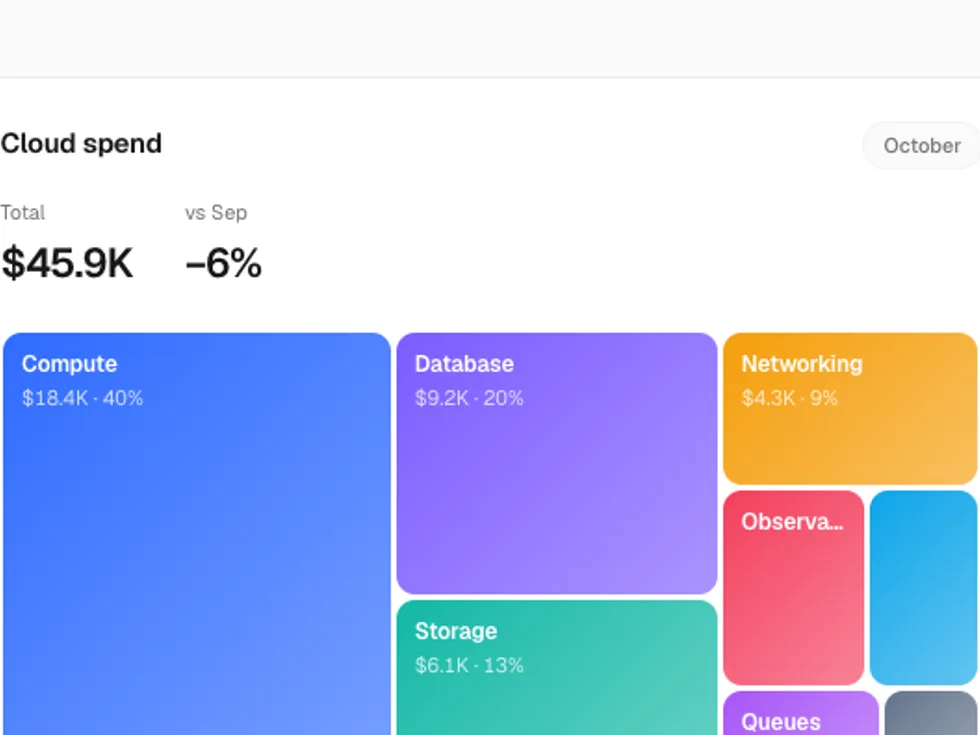
Gradient Treemap
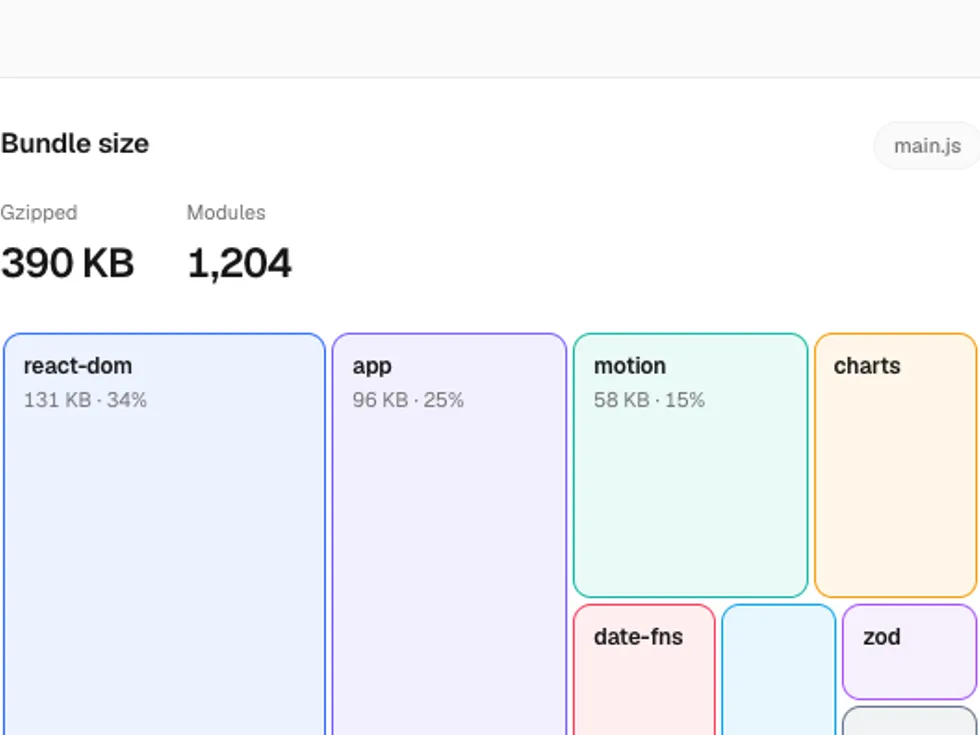
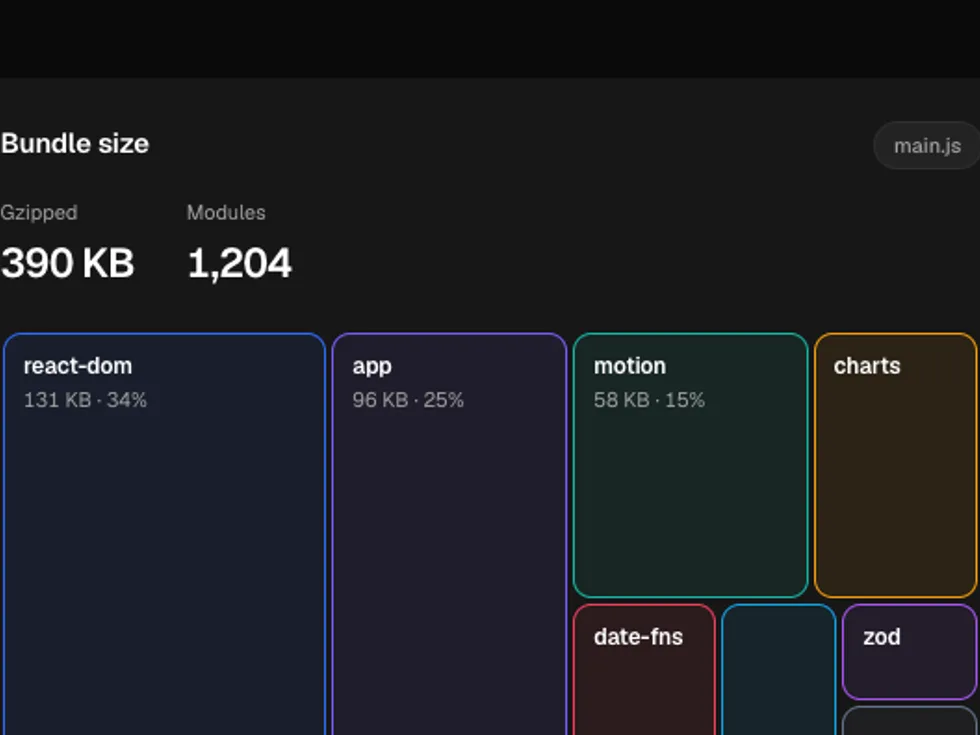
ChartTiles sized by value and laid out squarified, settling in largest first with labels where they fit; hovering shows the value and share — soft gradient fills that fade into the floor.
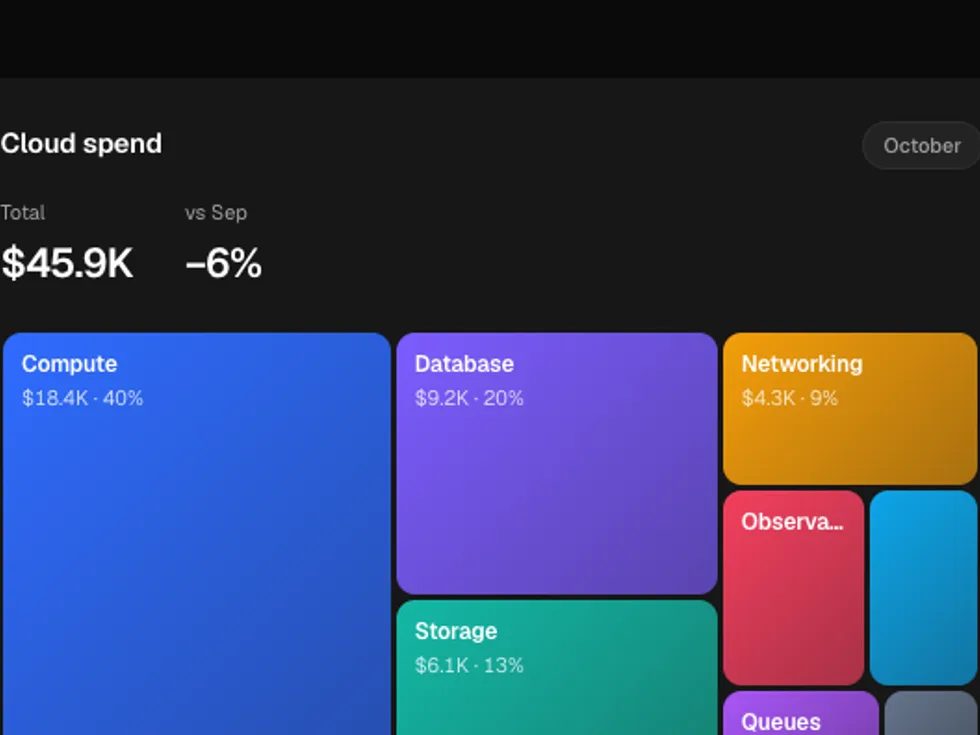
Outlined Treemap
ChartTiles sized by value and laid out squarified, settling in largest first with labels where they fit; hovering shows the value and share — hairline outlines over a faint tint.

Gradient Waffle Chart
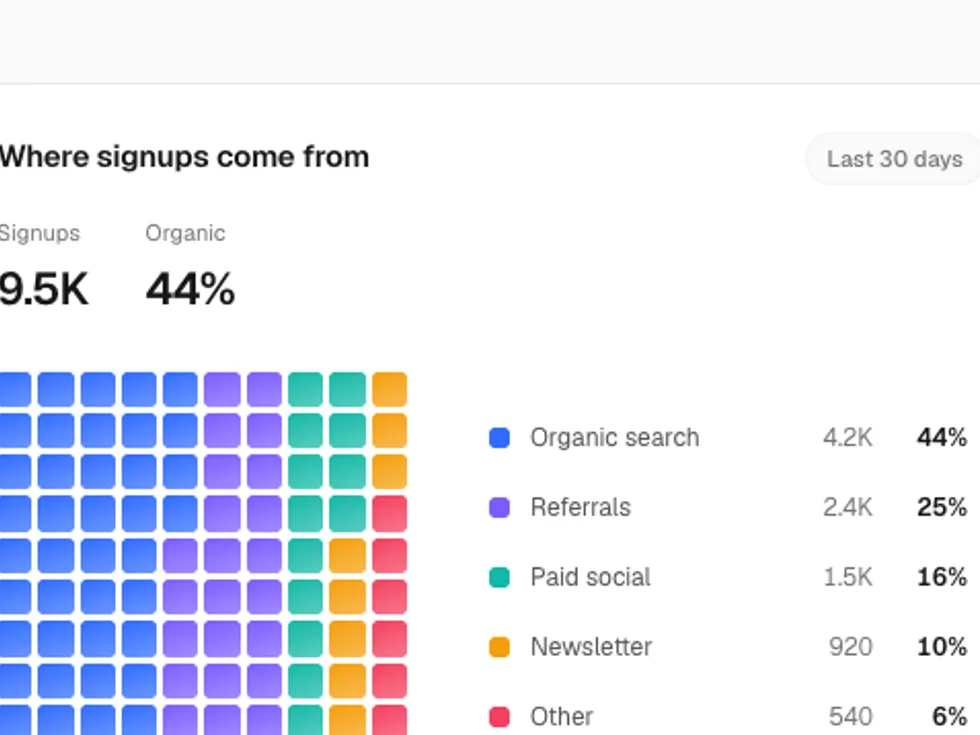
ChartShares of a whole as a grid of squares, one per percent, filling column by column with a legend beside; hovering lifts one category — soft gradient fills that fade into the floor.


Outlined Waffle Chart
ChartShares of a whole as a grid of squares, one per percent, filling column by column with a legend beside; hovering lifts one category — hairline outlines over a faint tint.
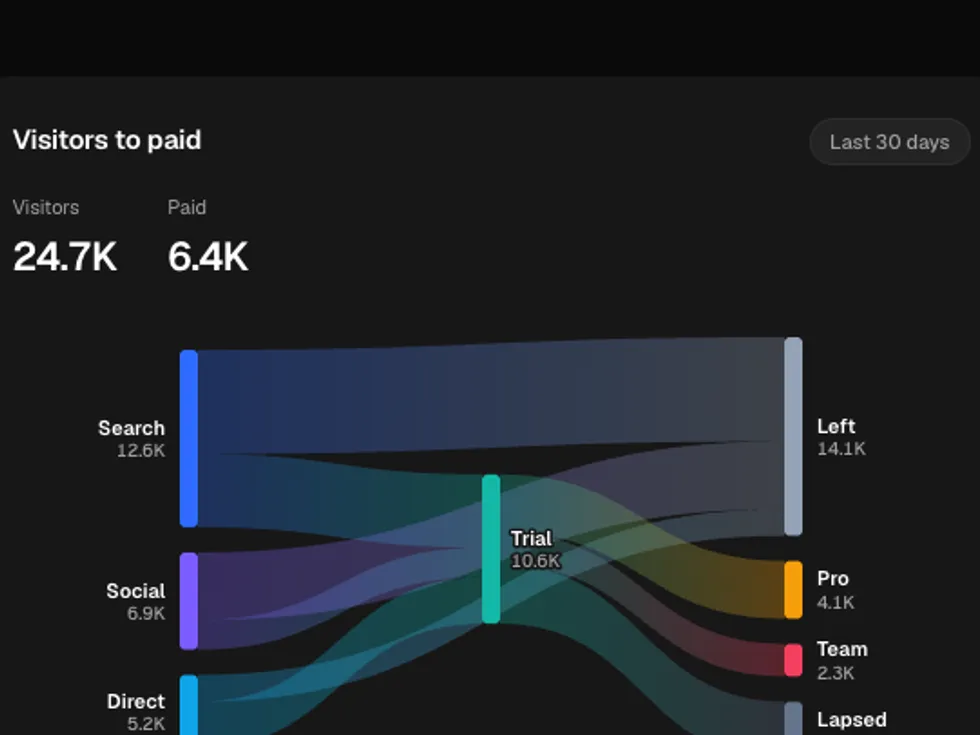
Gradient Sankey Chart
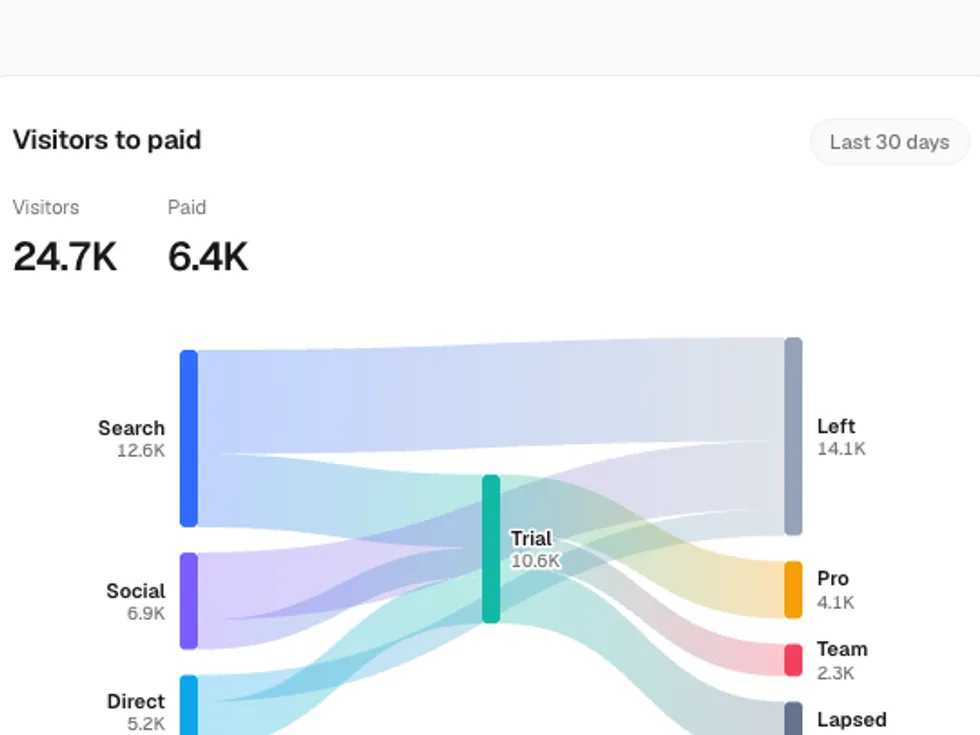
ChartNodes stacked in columns by what flows through them, with ribbons revealed left to right; hovering a ribbon or node picks out its flows — soft gradient fills that fade into the floor.
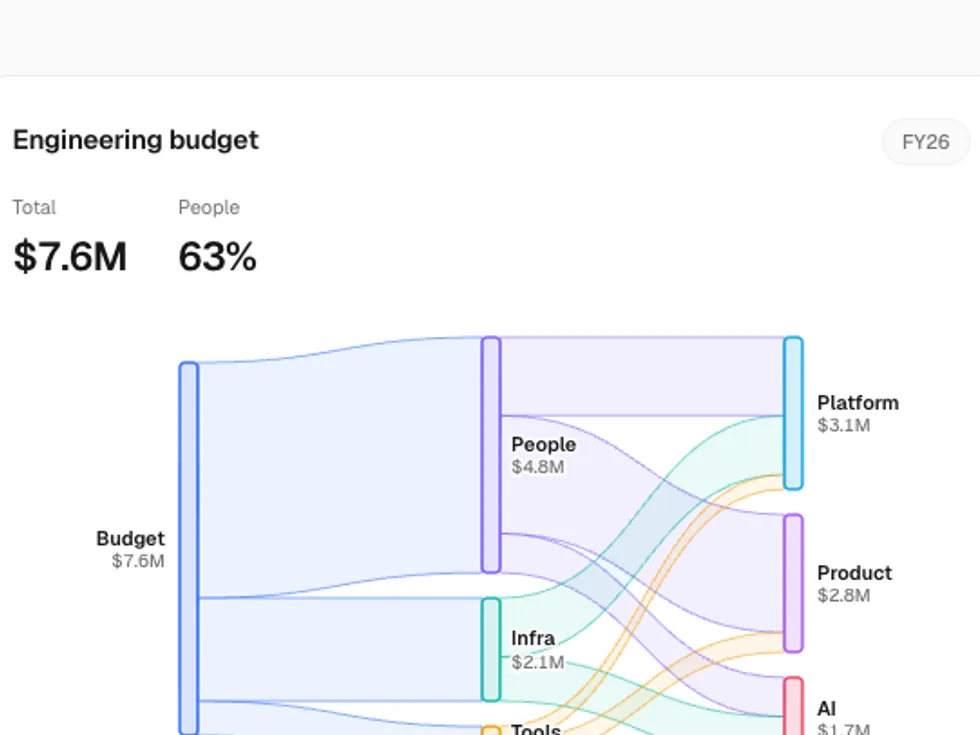
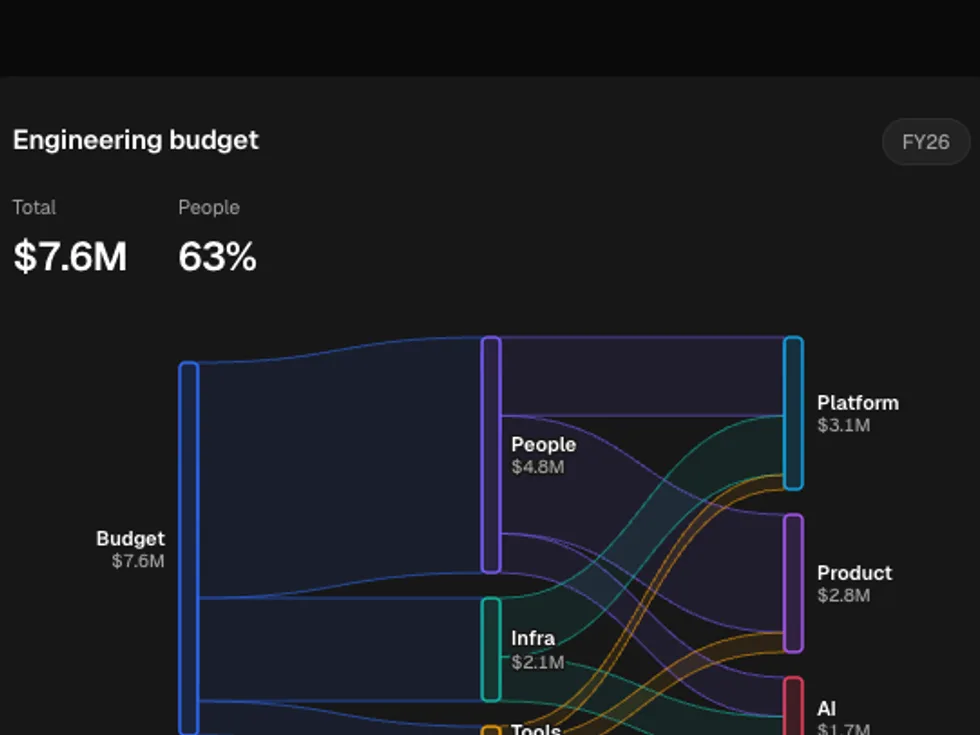
Outlined Sankey Chart
ChartNodes stacked in columns by what flows through them, with ribbons revealed left to right; hovering a ribbon or node picks out its flows — hairline outlines over a faint tint.